Consider the following set of data:
| Action | Horror | Comedy | Total | |
|---|---|---|---|---|
| Color-blind | 120 | 90 | 40 | 250 |
| Non color-blind | 110 | 95 | 45 | 250 |
| Total | 230 | 185 | 85 | 500 |
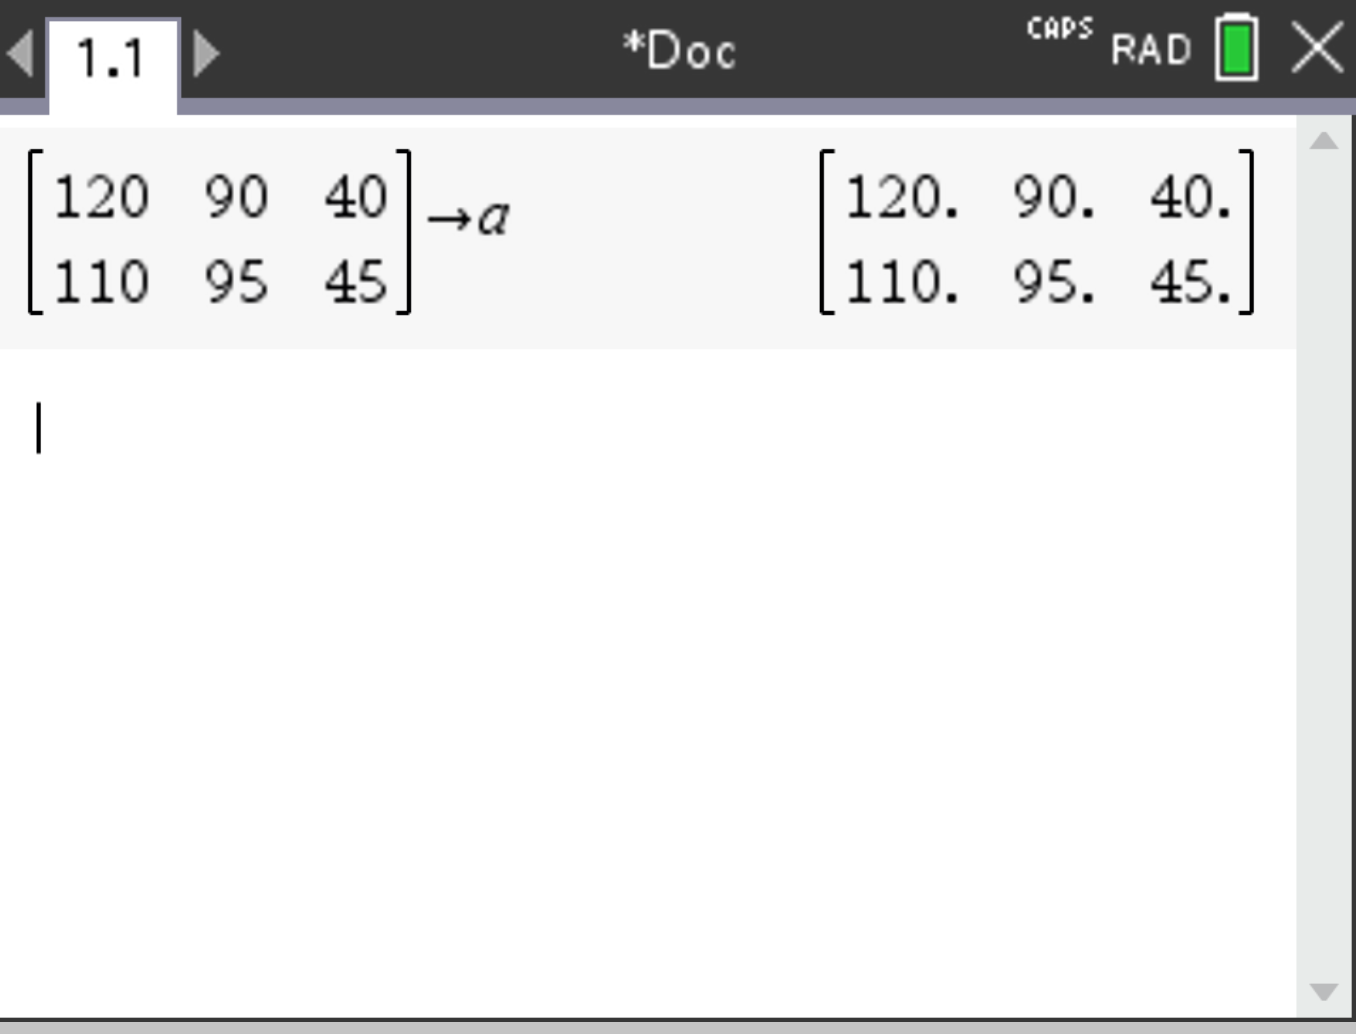
To be able to do a χ2 test, you first need to put the data in a matrix.
 , select Matrix & Vector > Create > Matrix. Set the matrix dimensions (2×3) and enter the data.
 then
then  and enter A:
, select Statistics > Stat Tests > χ² 2-way Test. Set matrix [A] as Observed. Press  .
.
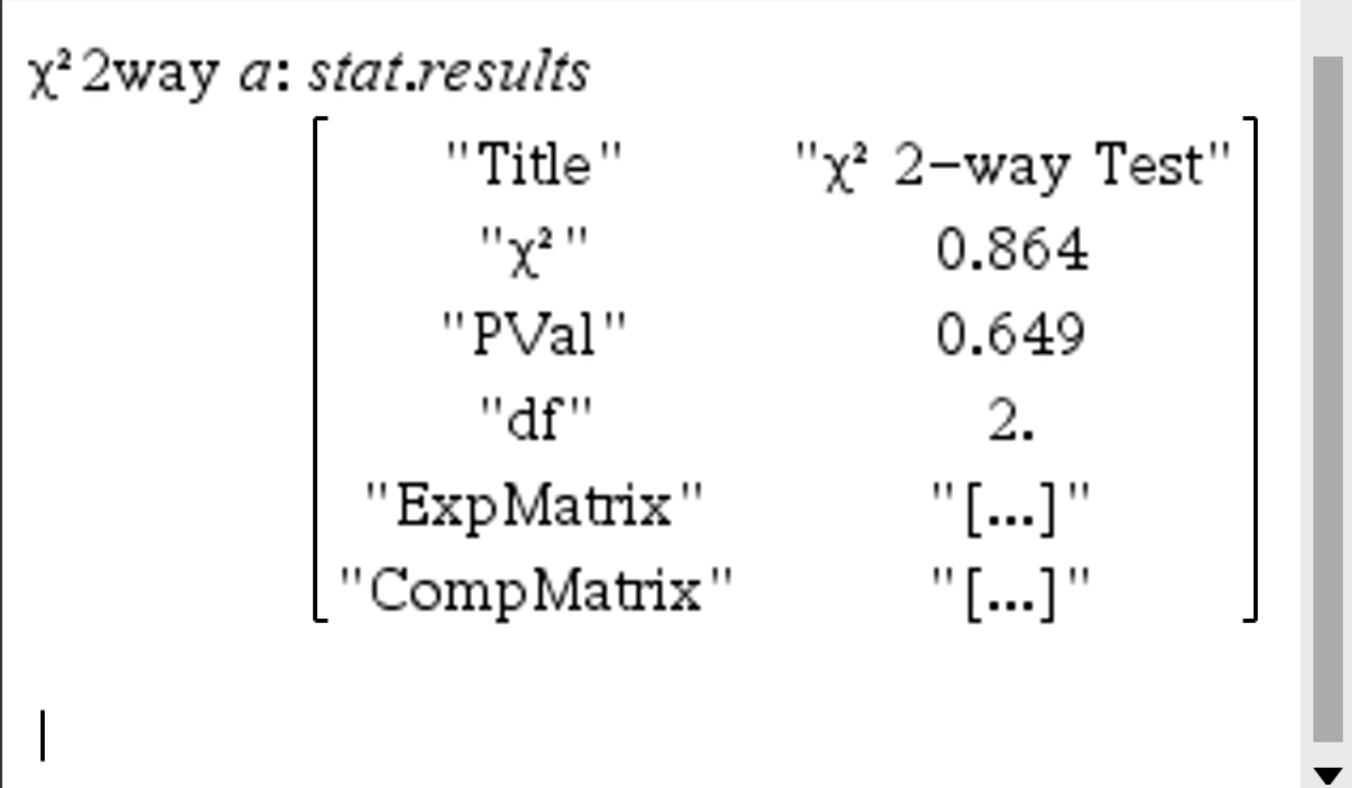
The results should display the χ² value and p-value for the test.
Consider a person counting the number of cyclists passing by their street each day:
| Day | Count |
|---|---|
| Monday | 50 |
| Tuesday | 60 |
| Wednesday | 42 |
| Thursday | 48 |
| Friday | 52 |
| Saturday | 58 |
| Sunday | 61 |
The null hypothesis (\(H_0\)) assumes that an equal number of cyclists pass by each day. The alternative hypothesis (\(H_1\)) assumes that the counts differ.
We want to know at a significance level of 0.05 if he must accept null hypothesis.
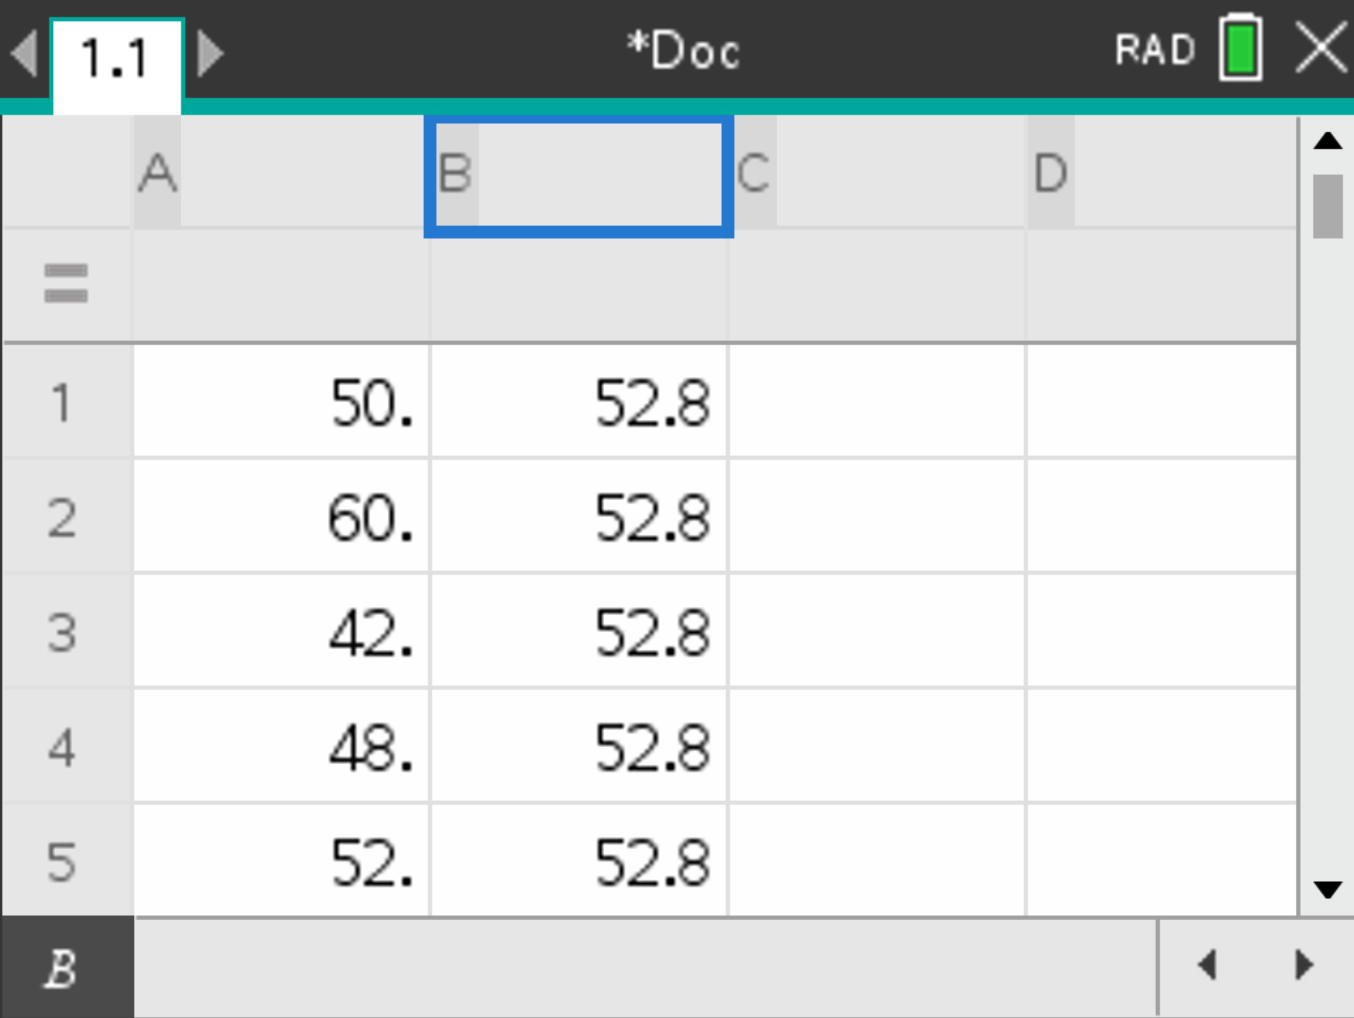
A with the cyclist counts and column B with the expected average count (52.8).
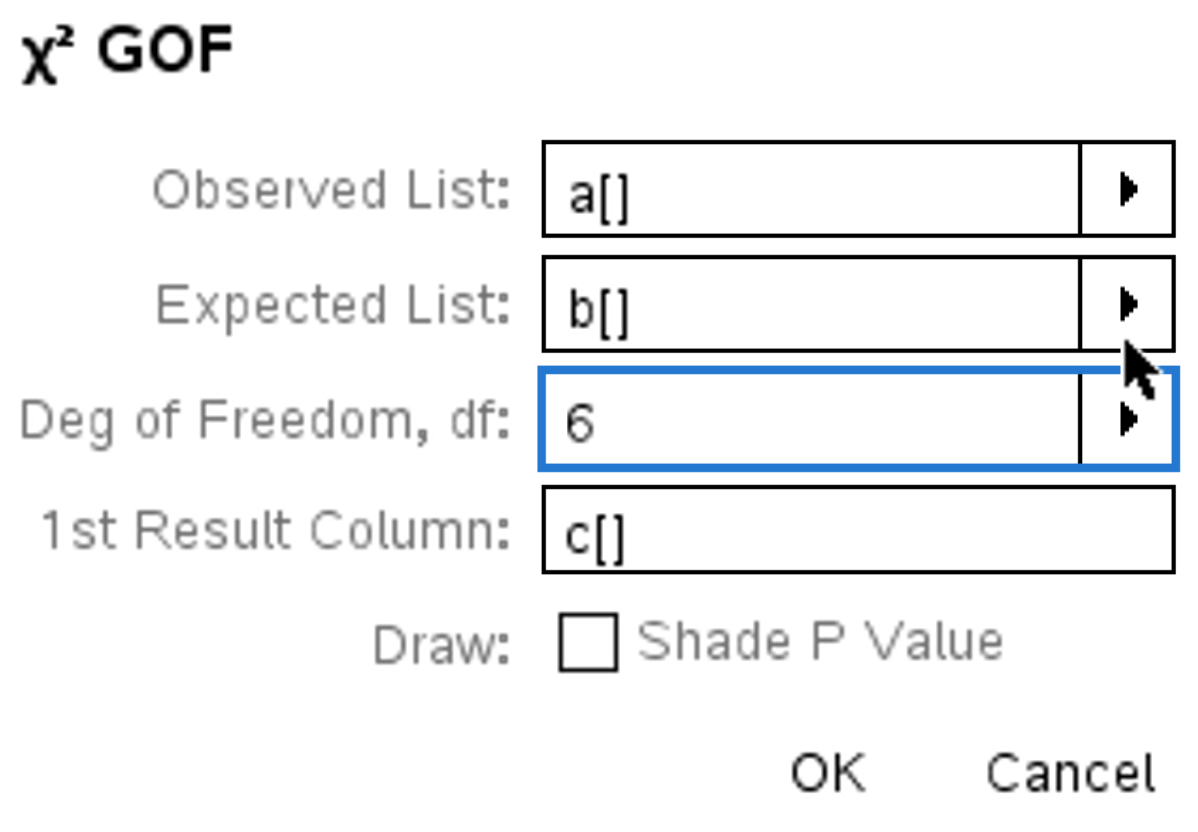
, select Statistics > Stat Tests > χ² GOF, and fill the parameters accordingly.
to view the results.
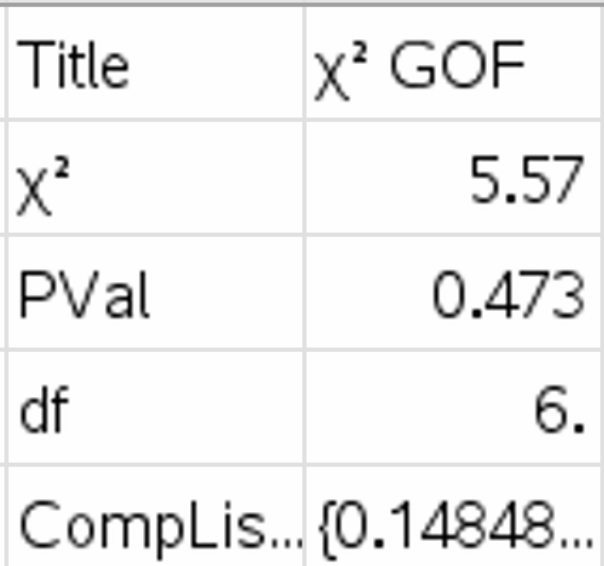
The results should display a χ² value of 5.57 and a p-value of 0.473. Since \(p > 0.05\), we accept the null hypothesis.
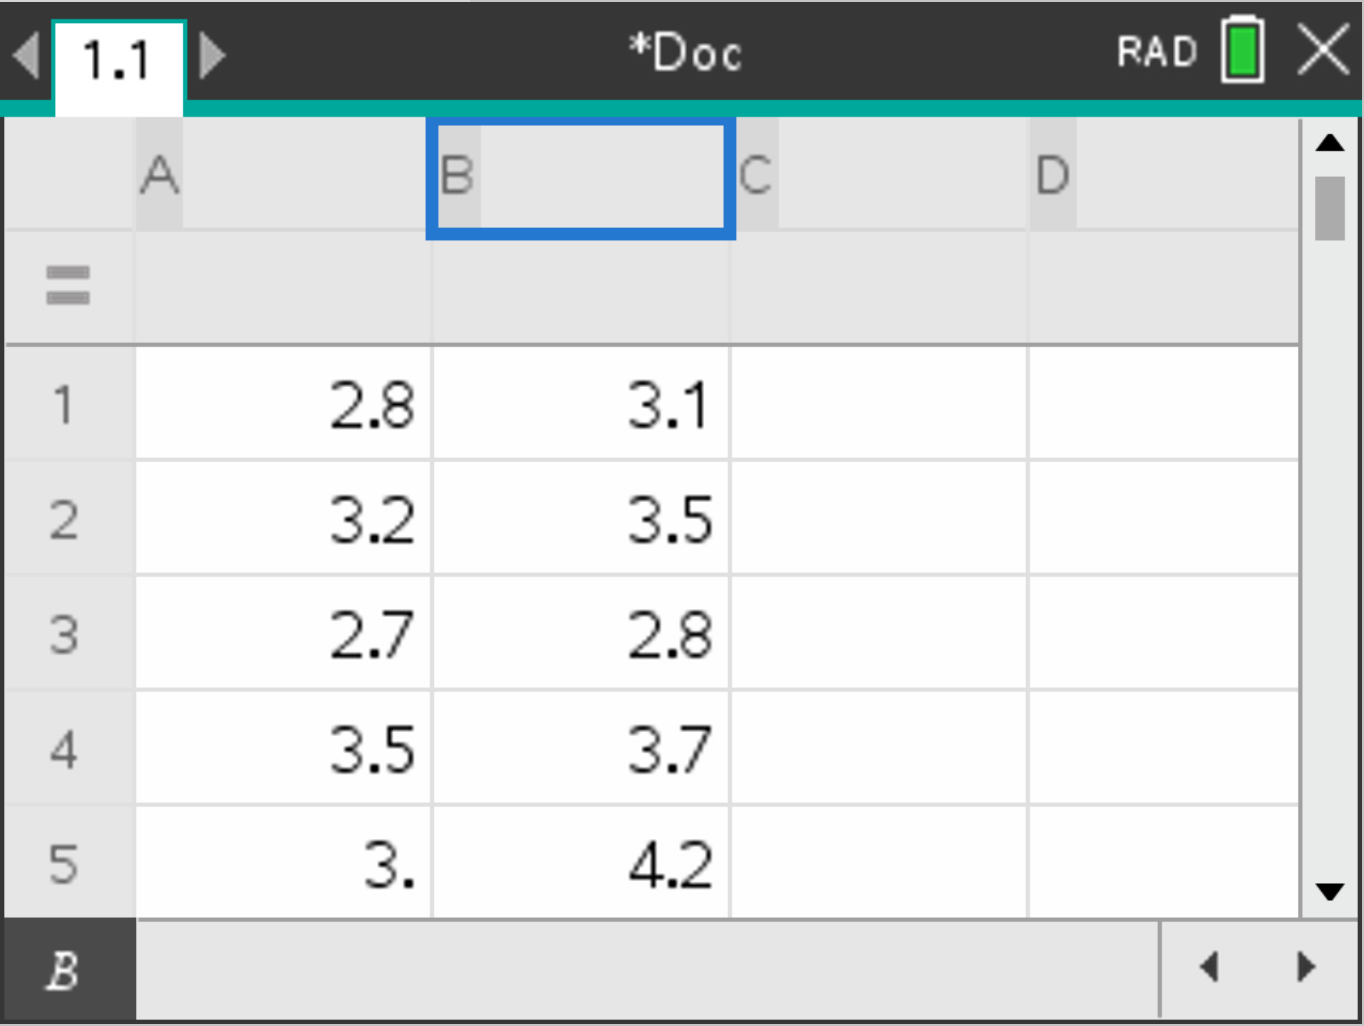
Consider the following data:
| \(x_1\) | \(x_2\) |
|---|---|
| 2.8 | 3.1 |
| 3.2 | 3.5 |
| 2.7 | 2.8 |
| 3.5 | 3.7 |
| 3.0 | 4.2 |
| 2.9 | 2.6 |
| 4.1 | 3.2 |
| 3.9 | 2.9 |
| - | 3.8 |
You want to test whether \(x_1 > x_2\) (\(H_1\)) at a significance level of 10%.
A with \(x_1\) values and column B with \(x_2\) values.
, select Statistics > Stat Tests > 2-Sample t-Test. Set data input as Data and fill the parameters accordingly.
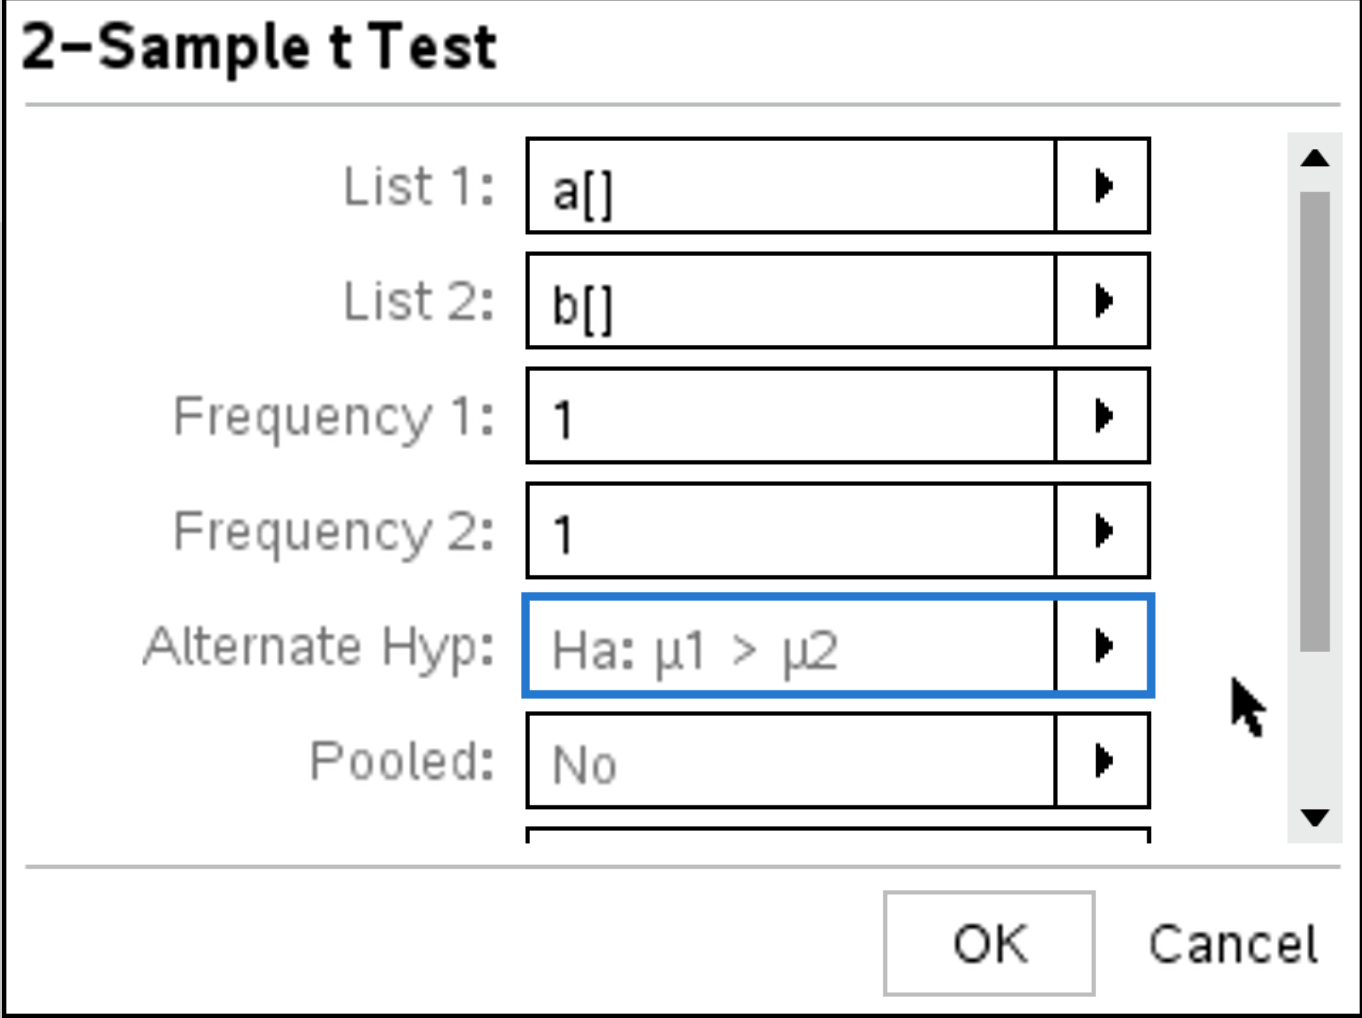
to view the results.
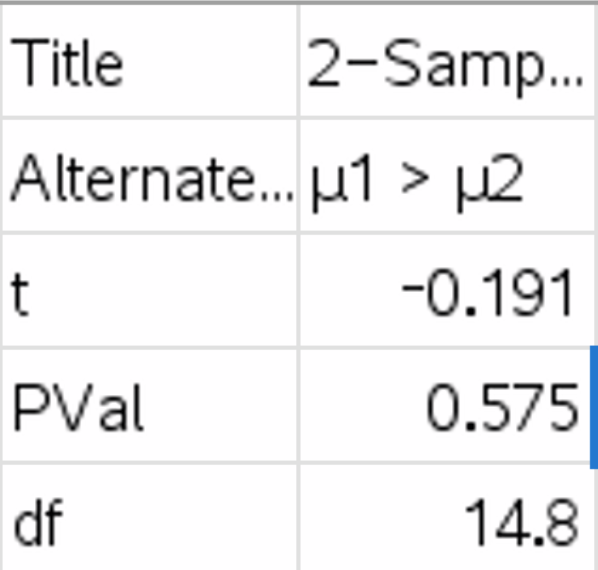
The results display \(t = -0.191\) and \(p = 0.575\). Since \(p > 0.10\), we accept the null hypothesis and conclude \(x_1 \leq x_2\).