Suppose you want to have a good graphical understanding of the function:
\[ f(x) = \frac{x^4 - x^2 + x - 1}{x^5 - 3x}. \]
f1(x)=. Then, press  .
.
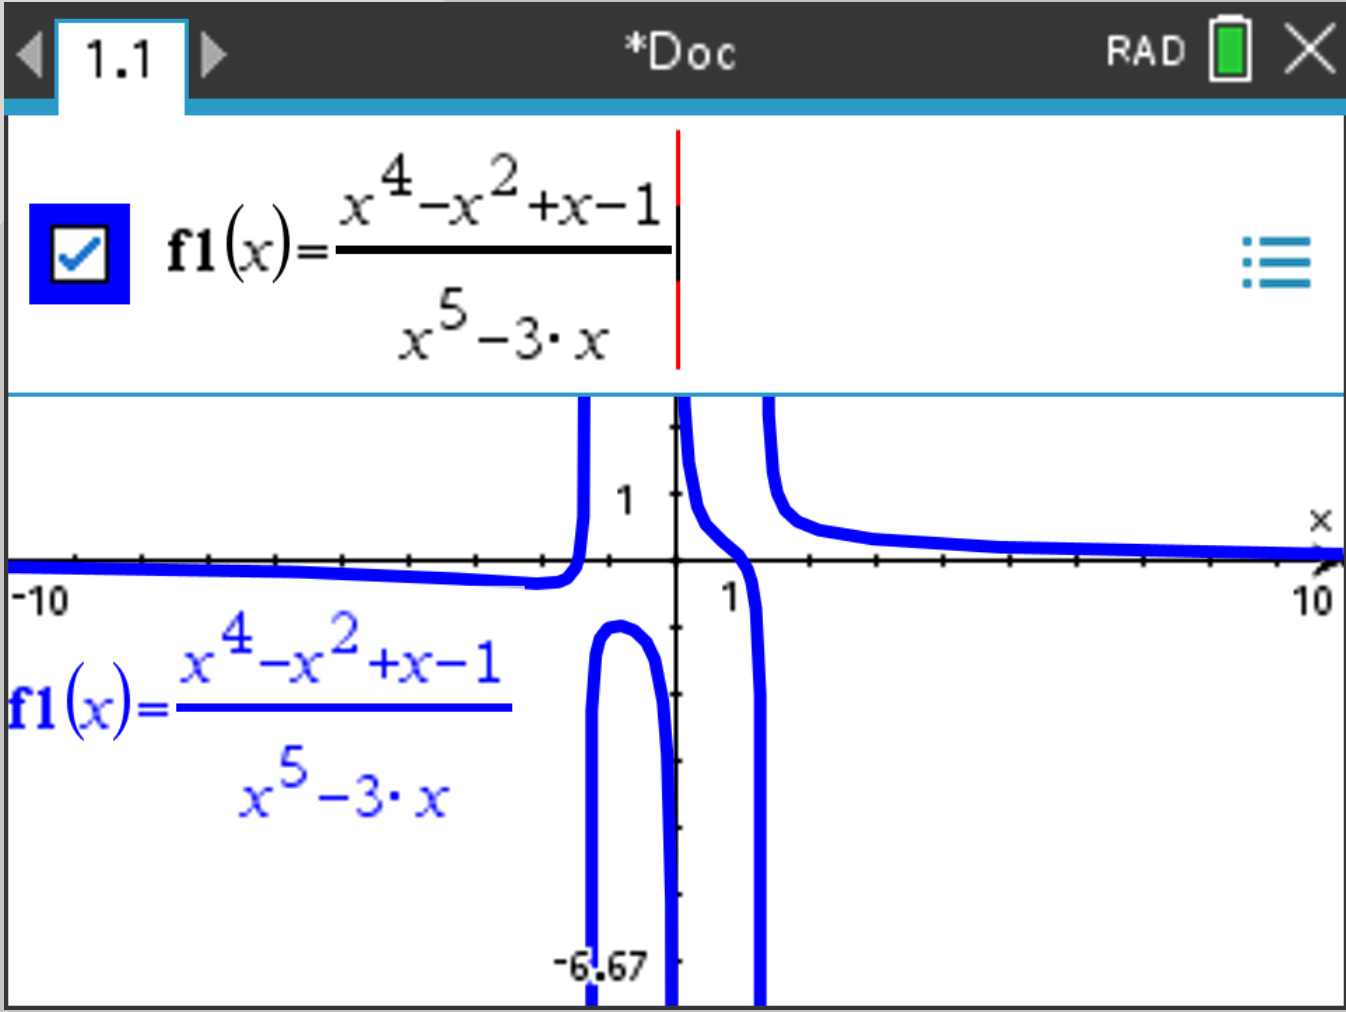
Tip 1: Make sure only the functions you are using are displayed. To deactivate/activate a function’s display,
select  , go to the function you want to activate/deactivate,
and check/uncheck the square.
, go to the function you want to activate/deactivate,
and check/uncheck the square.
and select
Window/Zoom > Window Settings. Enter appropriate values for Xmin, Xmax, Ymin, and
Ymax. Choose an XScale approximately twenty times smaller than the gap between Xmin and
Xmax. Usually, we set XScale to powers of 10.
Ymin and Ymax to be slightly beyond the range of your desired y-values.
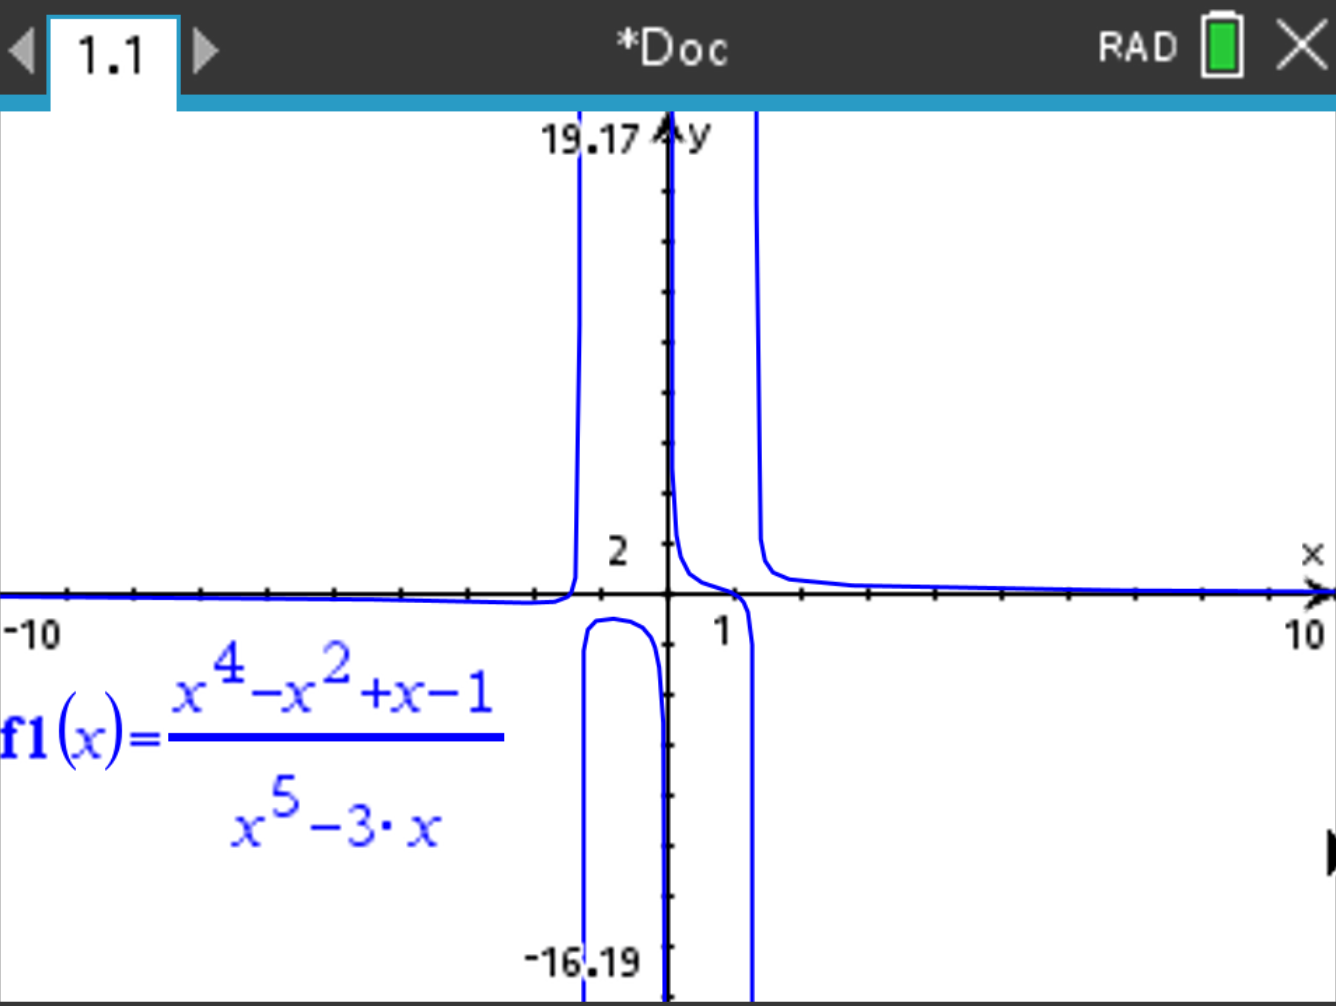
If you do not know which y-values to choose, press
and select Window/Zoom > Zoom - Fit to make the y-values graph pretilly. It should display this:
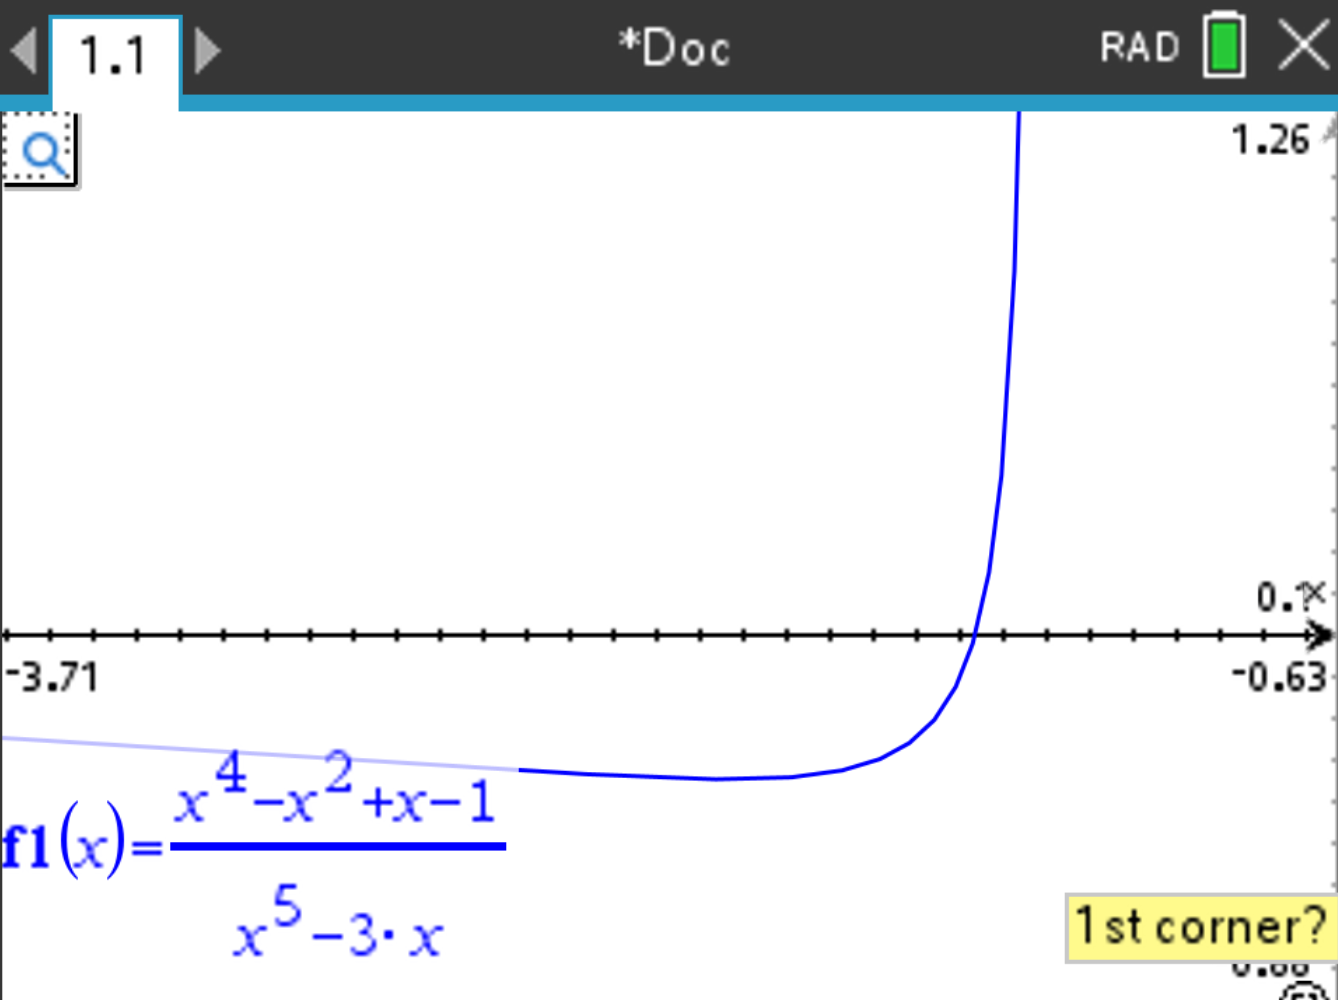
and select Window / Zoom > Zoom - Box.
and select
Use the arrows to move to a point on the screen that you want the top left corner of the screen
to be, and press
, select Window / Zoom > Zoom - Out.
f1(x)= and f2(x)=.
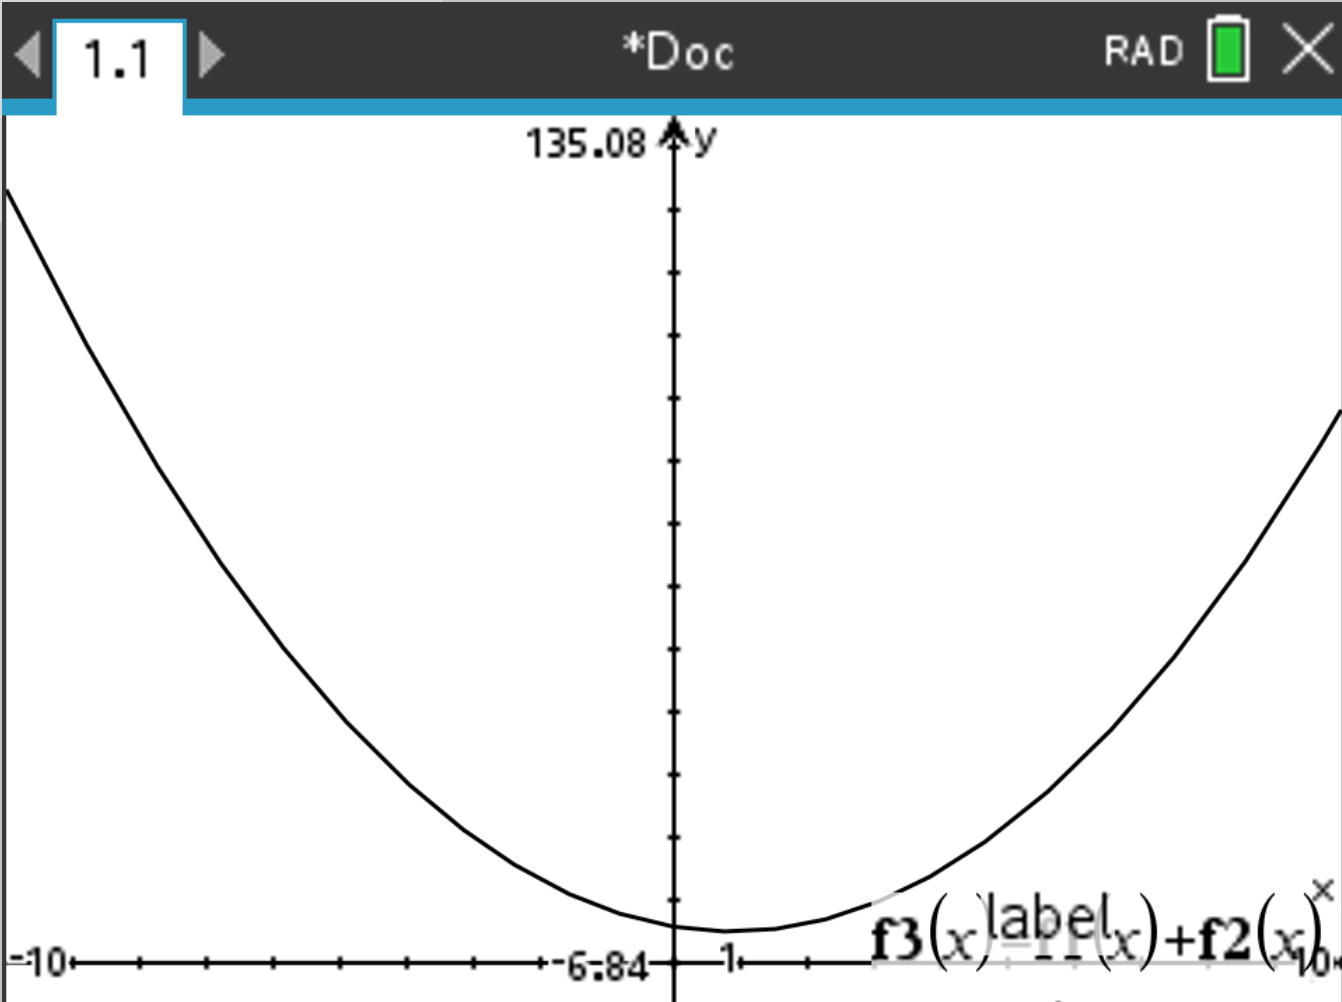
f3(x)=f1(x)+f2(x). Uncheck f1(x) and f2(x). Press
. The sum of the two functions is displayed.
The same procedure can be used for subtraction, multiplication, or division of two functions.