Suppose you want to do a linear regression on the following table:
| x | y |
|---|---|
| 2 | 9 |
| 5 | -6 |
| 8 | -7 |
| 15.5 | -28 |
| 16.2 | -15 |
| 14 | -20 |
| 12 | -15 |
| 13 | -20.3 |
| 2.5 | 9 |
| 1 | 4.1 |
| 0.5 | 6 |
| -3 | 12.1 |

 and select Statistics > Stat Calculations > Two-Variable Statistics. Fill the parameters as follows:
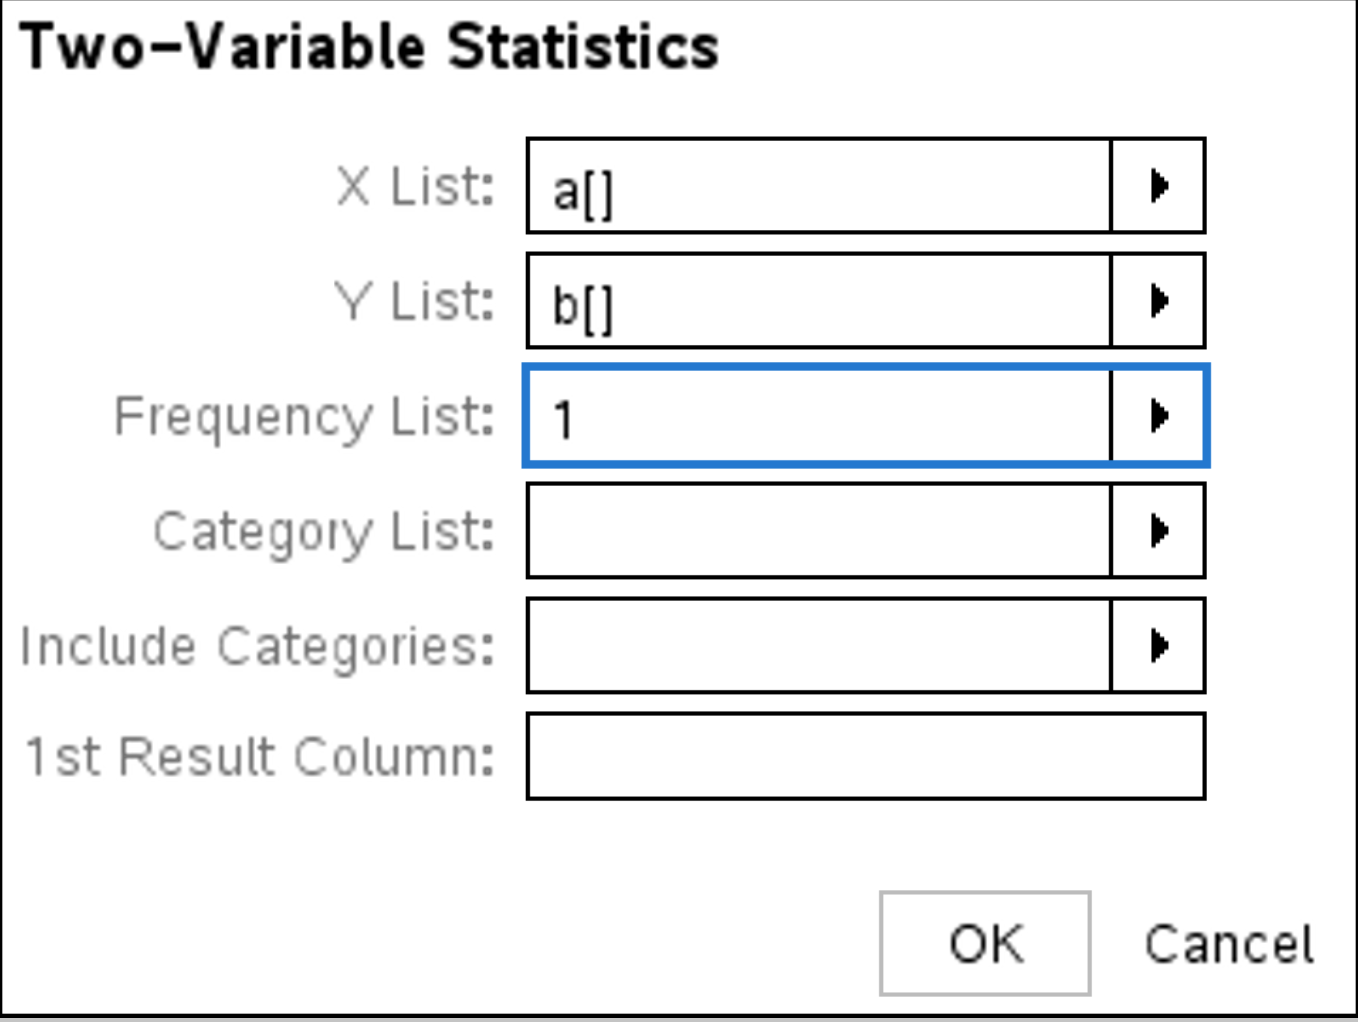
 . The results are displayed in the table and should be \( \bar{x} = 7.23 \) and \( \bar{y} = -5.93 \).
and select Statistics > Stat Calculations > Linear Regression (\( ax + b \)).
. The results are displayed in the table and should be \( \bar{x} = 7.23 \) and \( \bar{y} = -5.93 \).
and select Statistics > Stat Calculations > Linear Regression (\( ax + b \)).
Choose the parameters as follows:
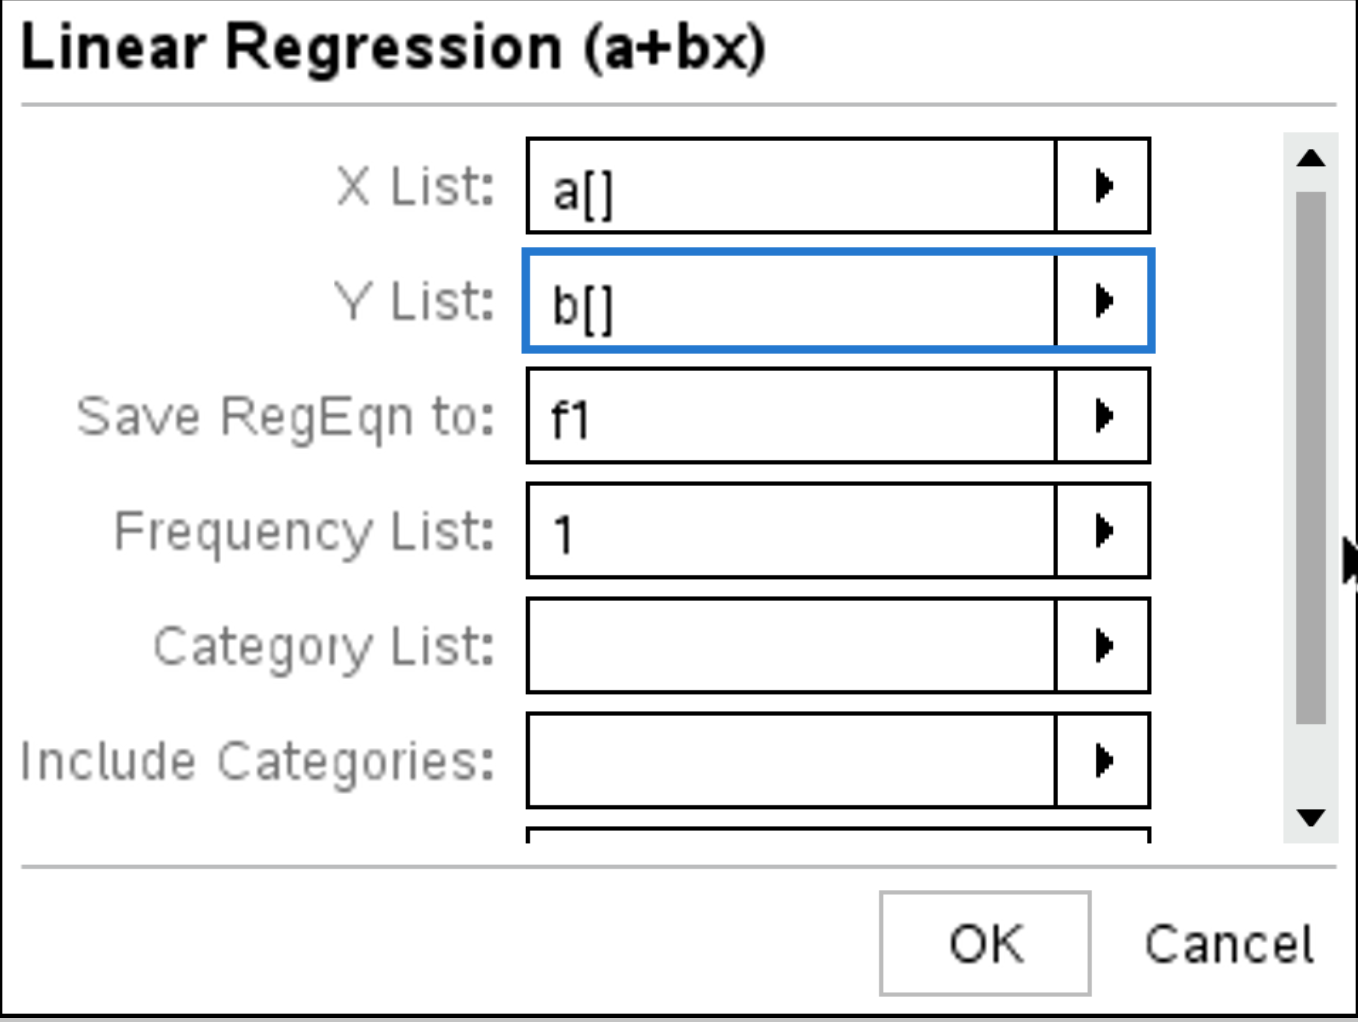
. The following result should appear:

 and select Add Data & Statistics.
stat.yreg. In the x-axis name, select stat.xreg.
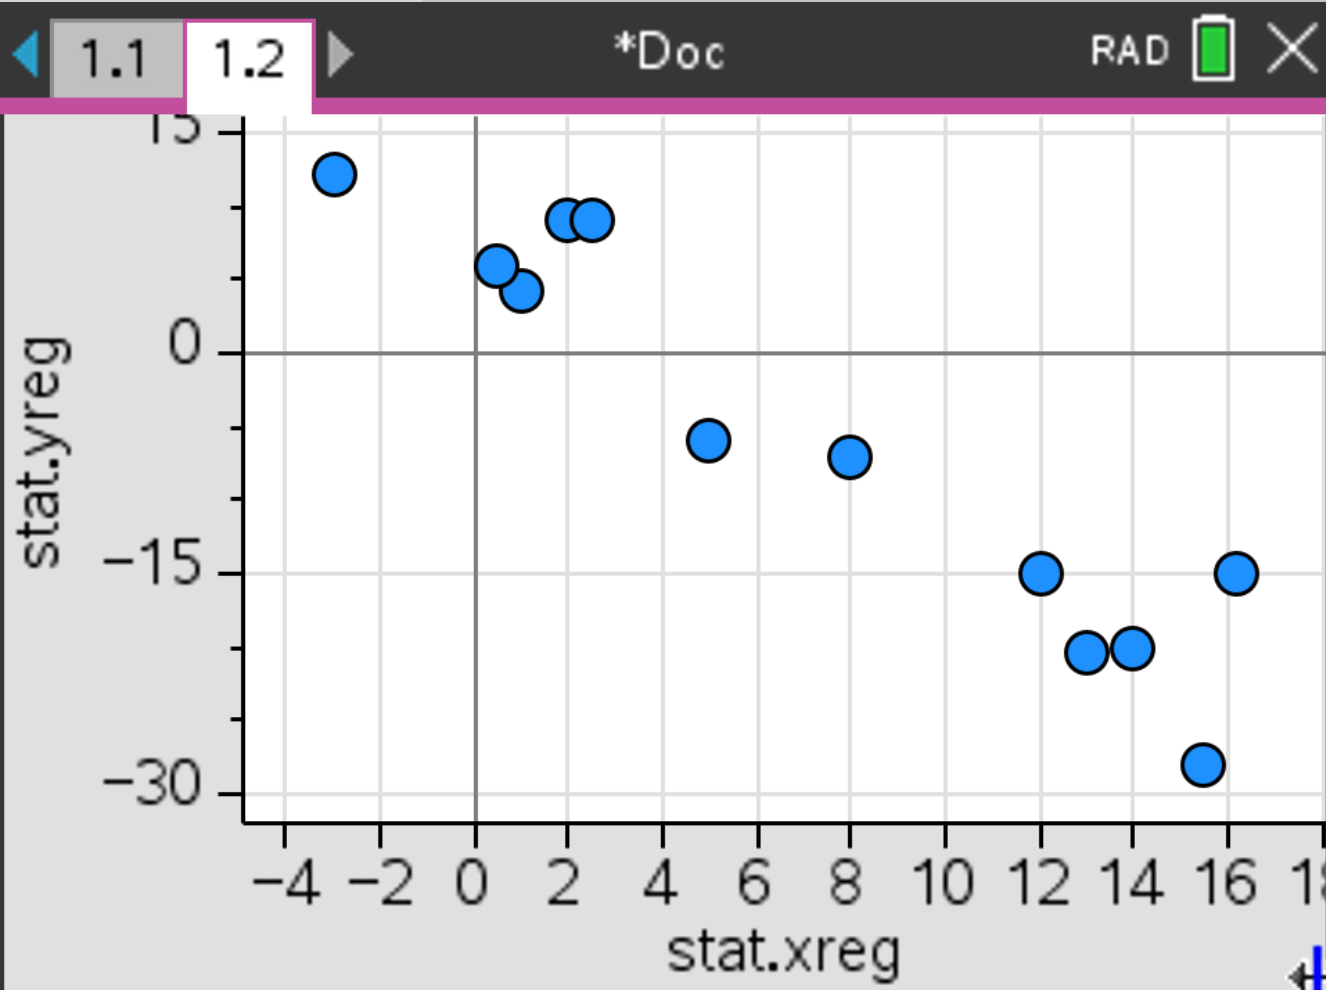
and select Analyze > Regression > Show Linear (\( ax+b \)). Press .
