Suppose you want to evaluate \( \frac{df}{dx} \) at \( x = 3 \) for the following function:
\[ f(x) = \frac{x^2 - 2x + 2}{x^3} \]
f(x), press  , then
  . Write the expression of the function.
 and select Calculus > Derivative at a Point.
x as the Variable and 3 as the Value. Press  . Write
 f(x) inside the brackets.
Press
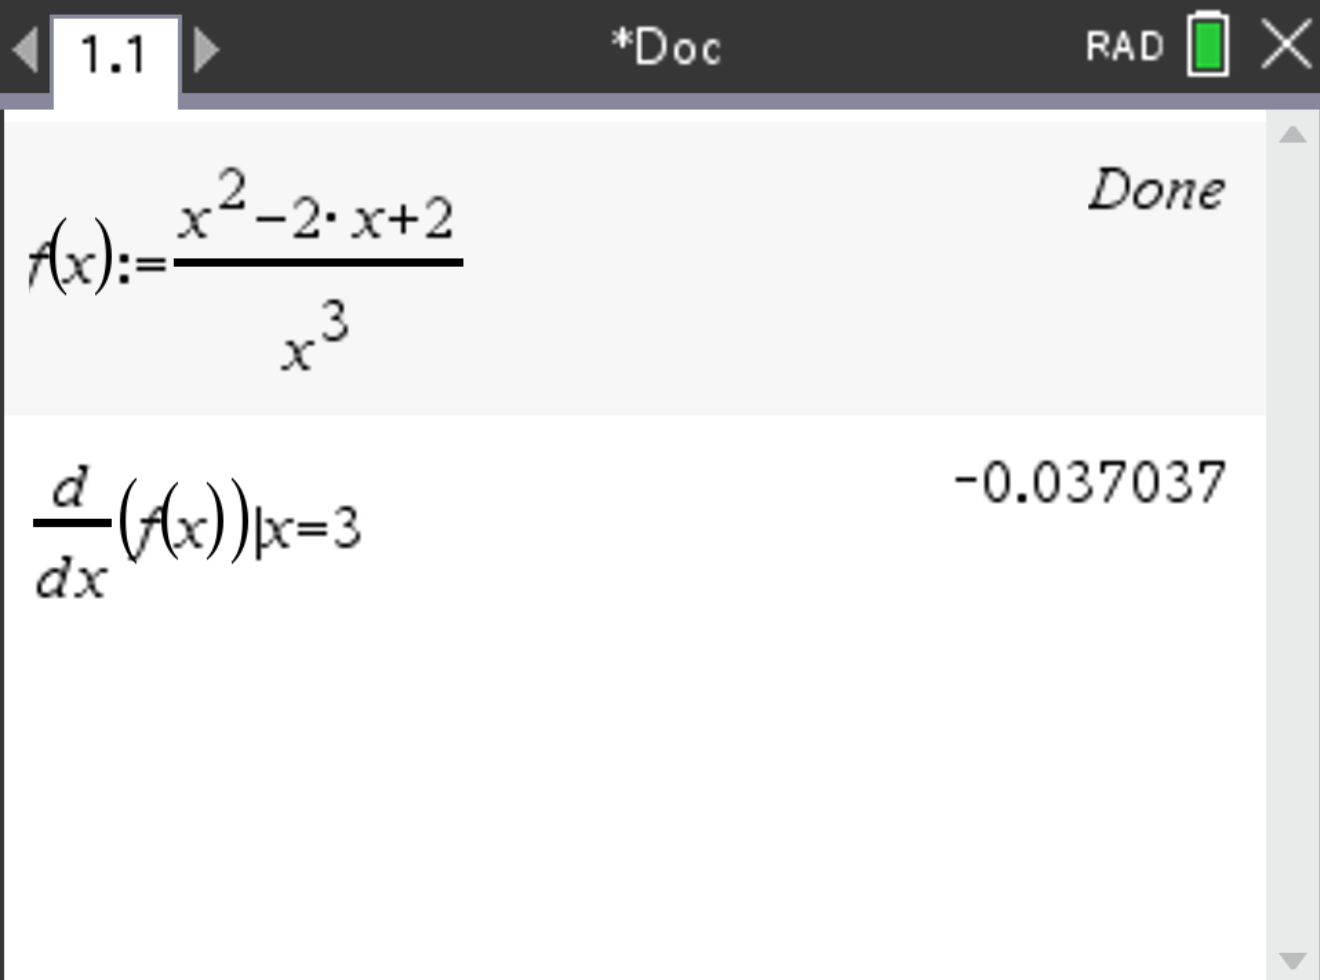
The result should be \( -0.037 \) (rounded). Thus, \( f'(3) = -0.037 \).
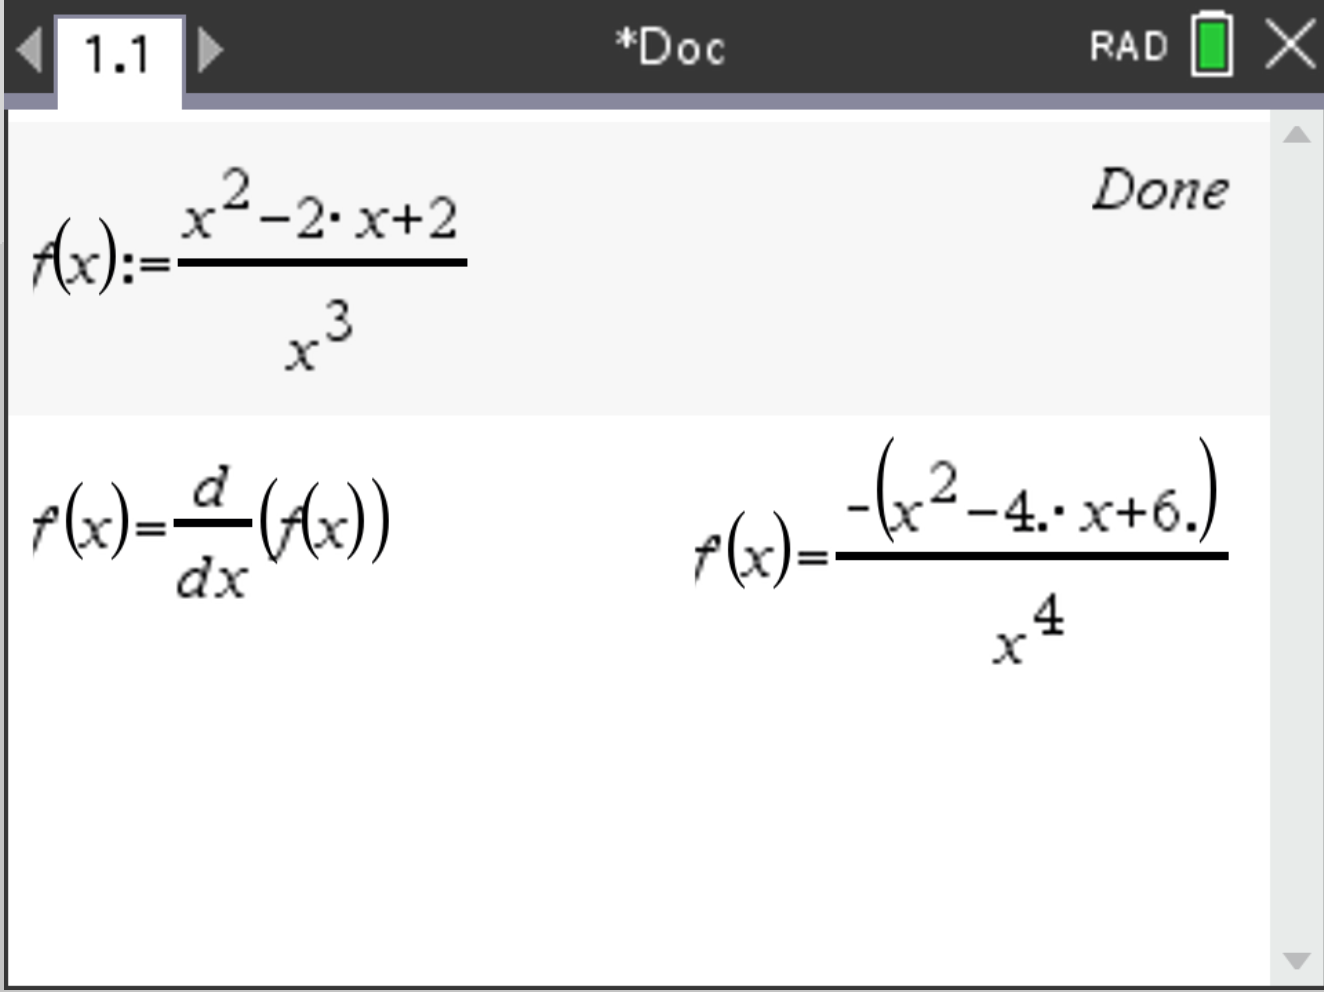
Suppose you want to draw the graph of \( \frac{df}{dx} \) for the following function:
\[ f(x) = \frac{x^2 - 2x + 2}{x^3} \]
f(x), press , then . Write the expression of the function. Press .
fd(x). Press and to define the function.
Then, press , select Calculus > Derivative, and write f(x) inside the brackets. Press . The derivative is displayed.
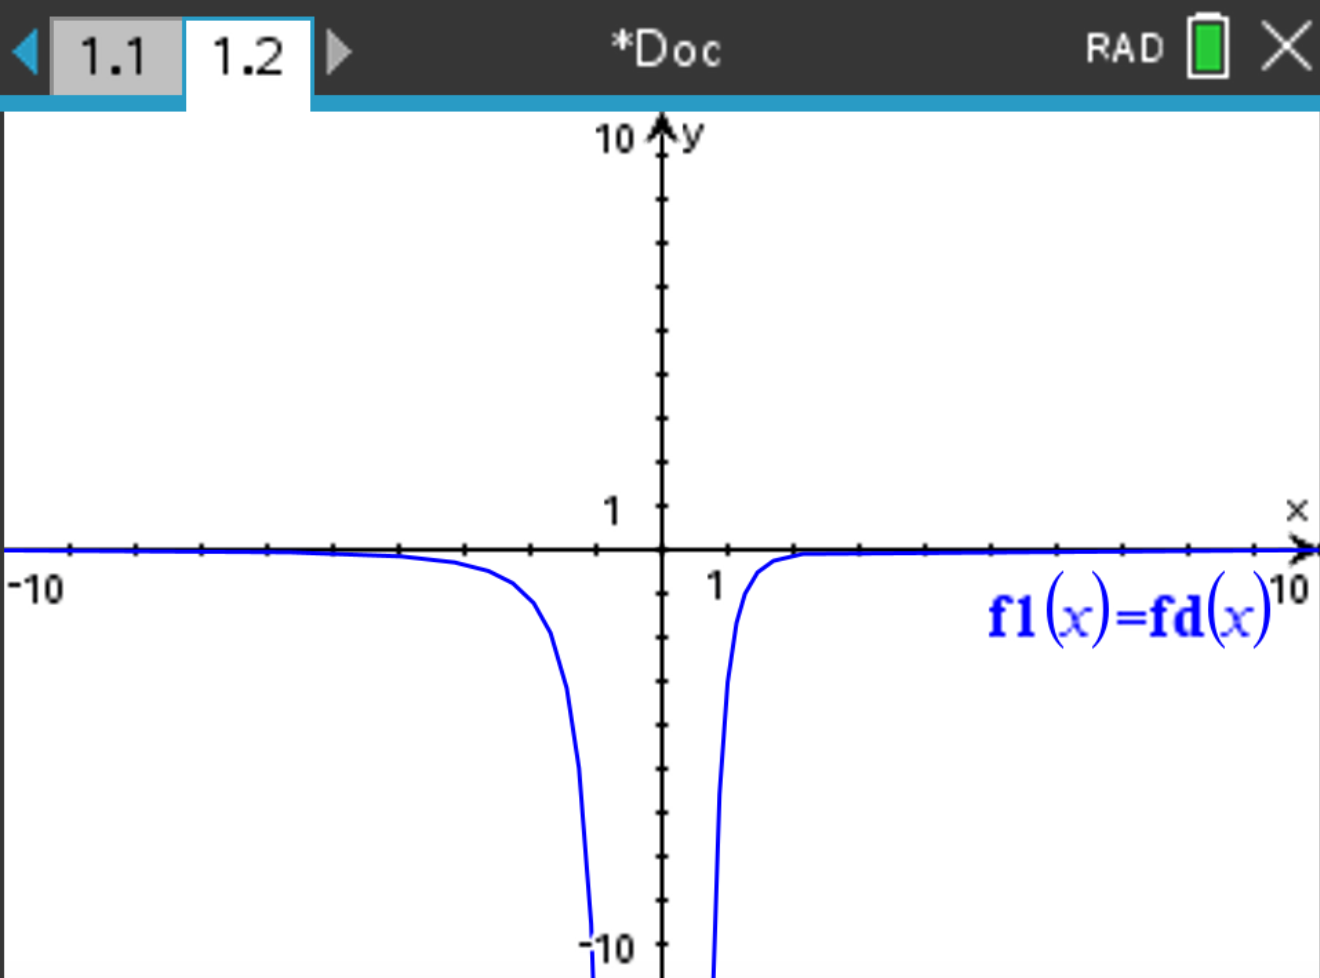
and  . Select Add Graphs.
f1(x) = fd(x) and press .
The graph should display as follows: