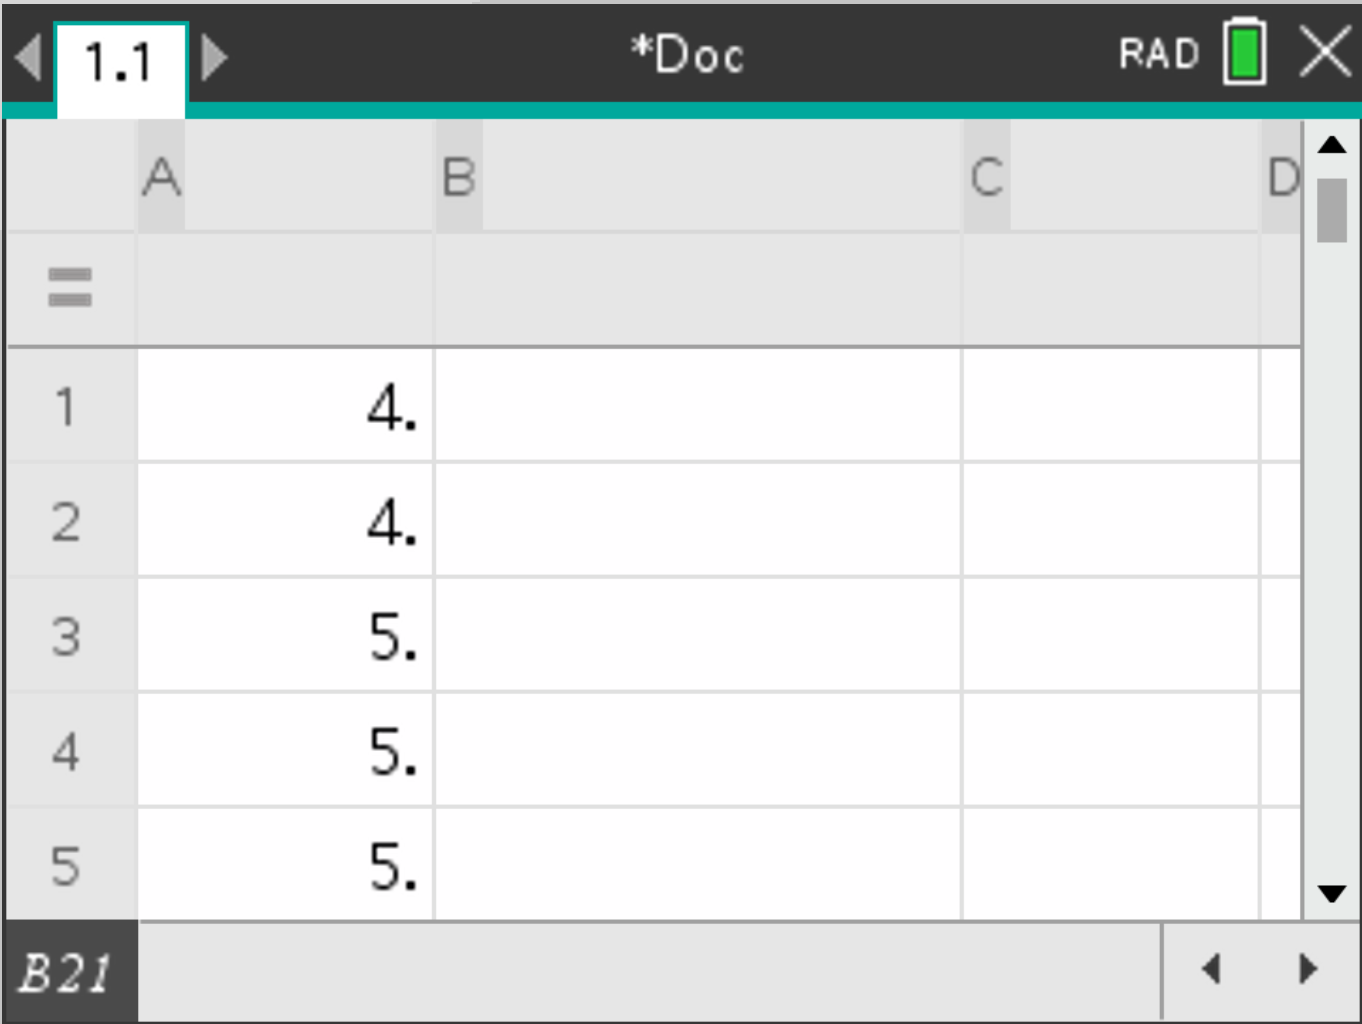
Suppose you want to calculate statistical measures on the following sorted data:
4, 4, 5, 5, 5, 6, 6, 6, 6, 6, 7, 7, 8, 8, 8, 8, 8, 8, 9, 9
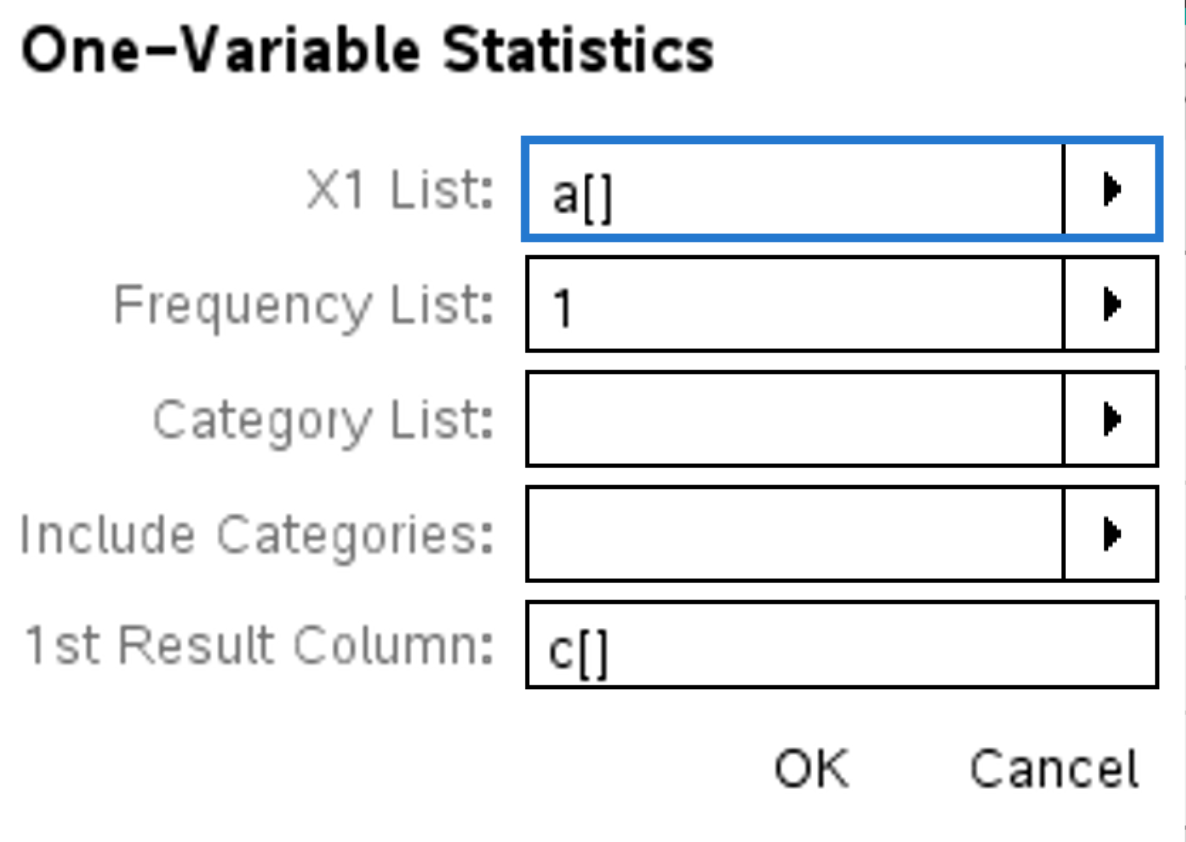
 , select Statistics > Stat Calculations > One-Variable Statistics, and select the parameters as follows:
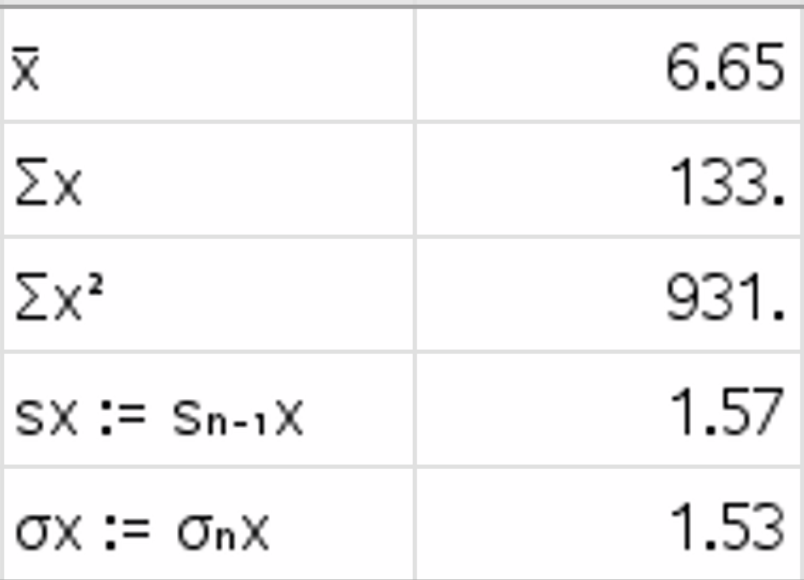
Press  . These results are displayed:
Here is the table of notations:
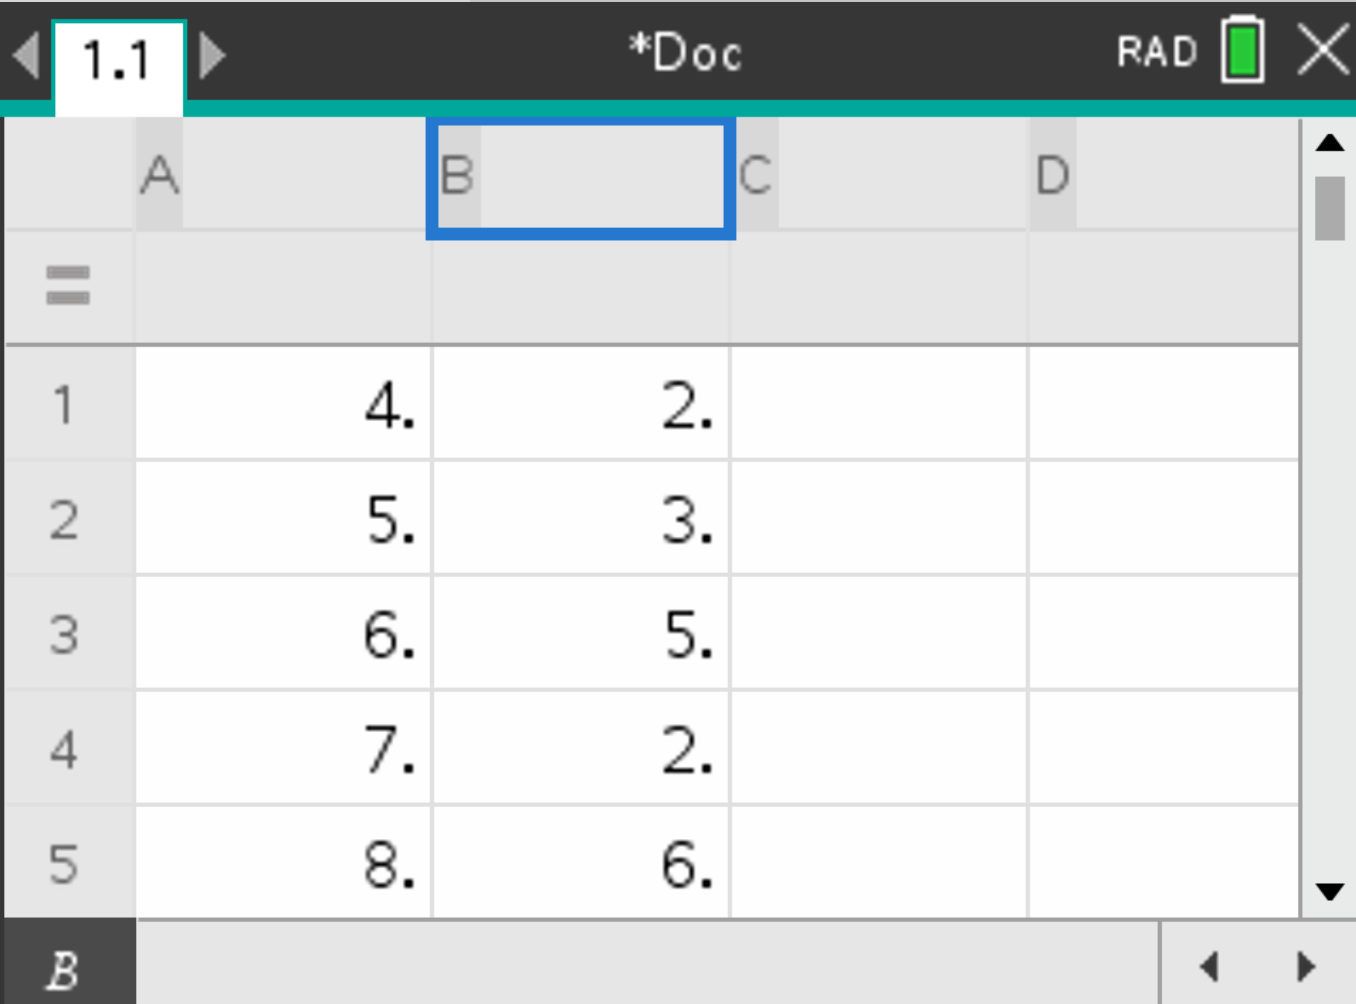
x̄: meann: size of the sampleΣx: sum of all valuesΣx²: sum of all squares of valuesSx: standard deviation of the sampleσx: estimation of the population's standard deviationMinX: minimal valueQ1X: lower quartileMedianX: medianQ3X: upper quartileMaxX: maximal valueConsider the following data:
| Values | Frequency |
|---|---|
| 4 | 2 |
| 5 | 3 |
| 6 | 5 |
| 7 | 2 |
| 8 | 6 |
| 9 | 2 |
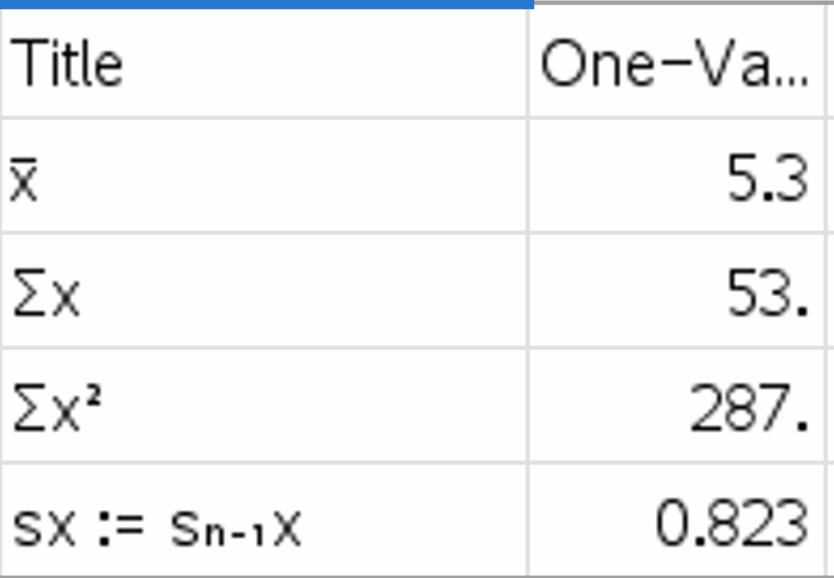
, select Statistics > Stat Calculations > One-Variable Statistics, and fill the parameters as follows:
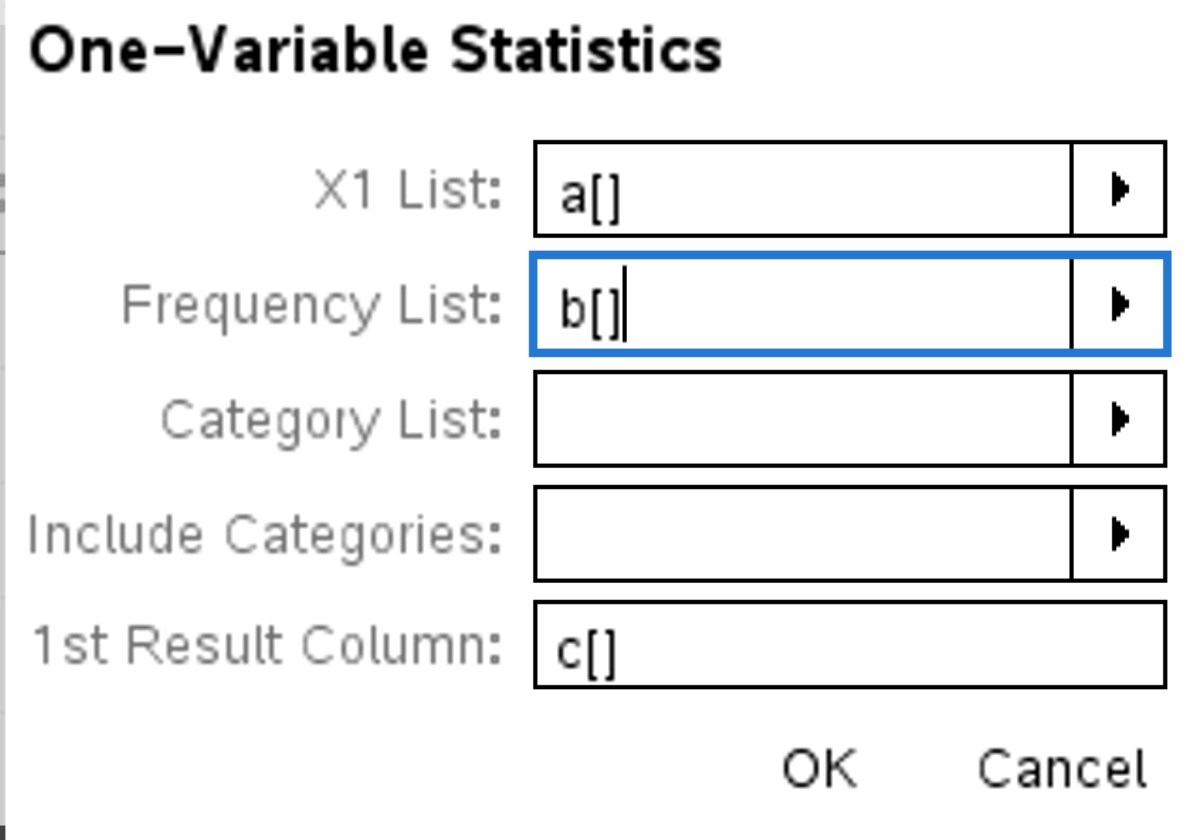
Press . These results are displayed: