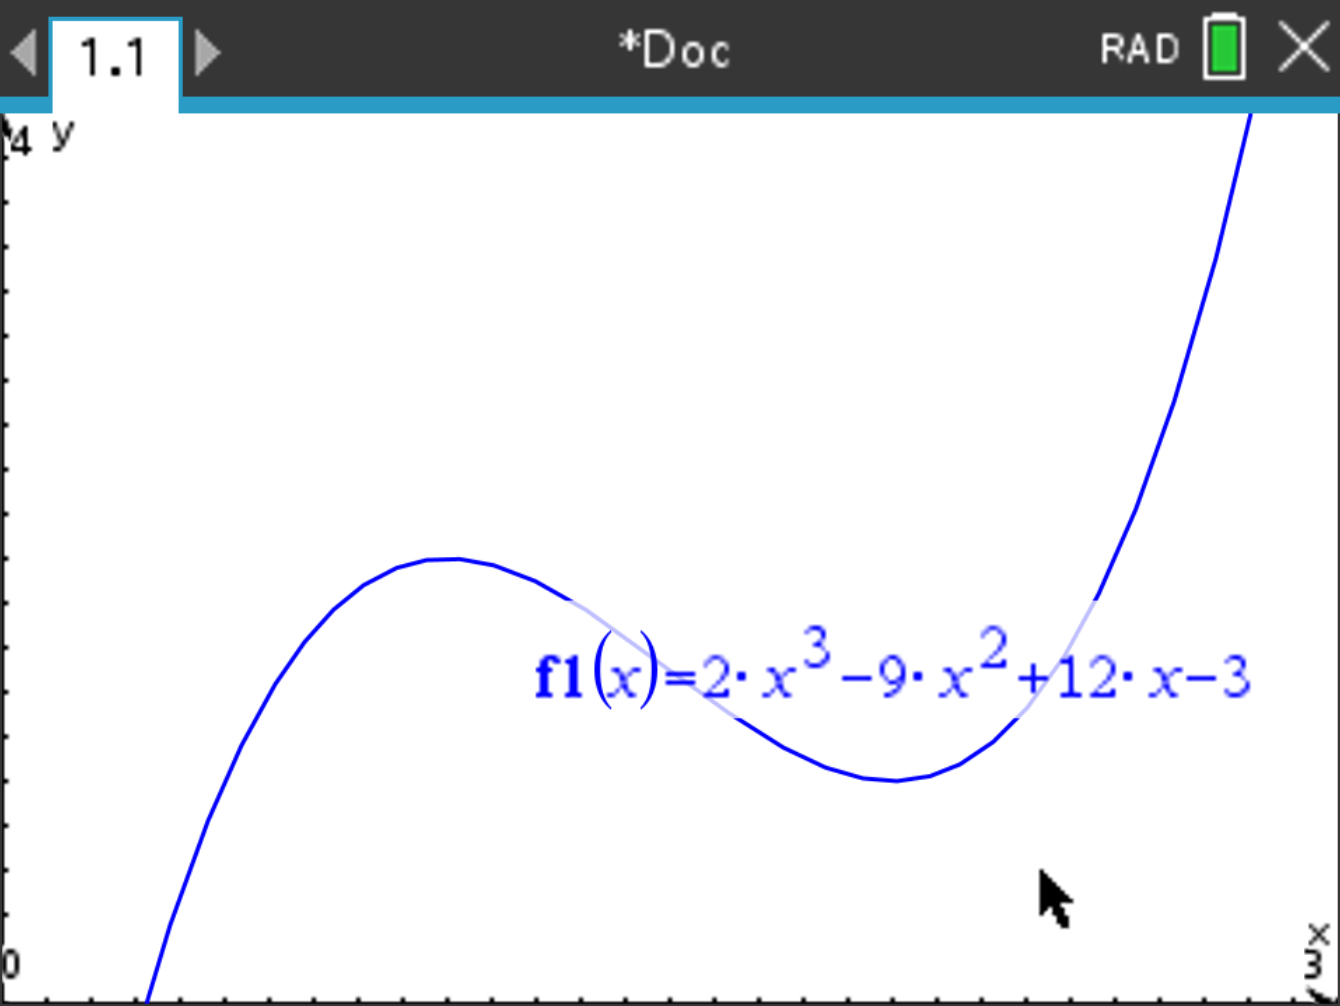
Suppose you want to know the local maximums and minimums of the following function:
\[ f(x) = 2x^3 - 9x^2 + 12x - 3 \]
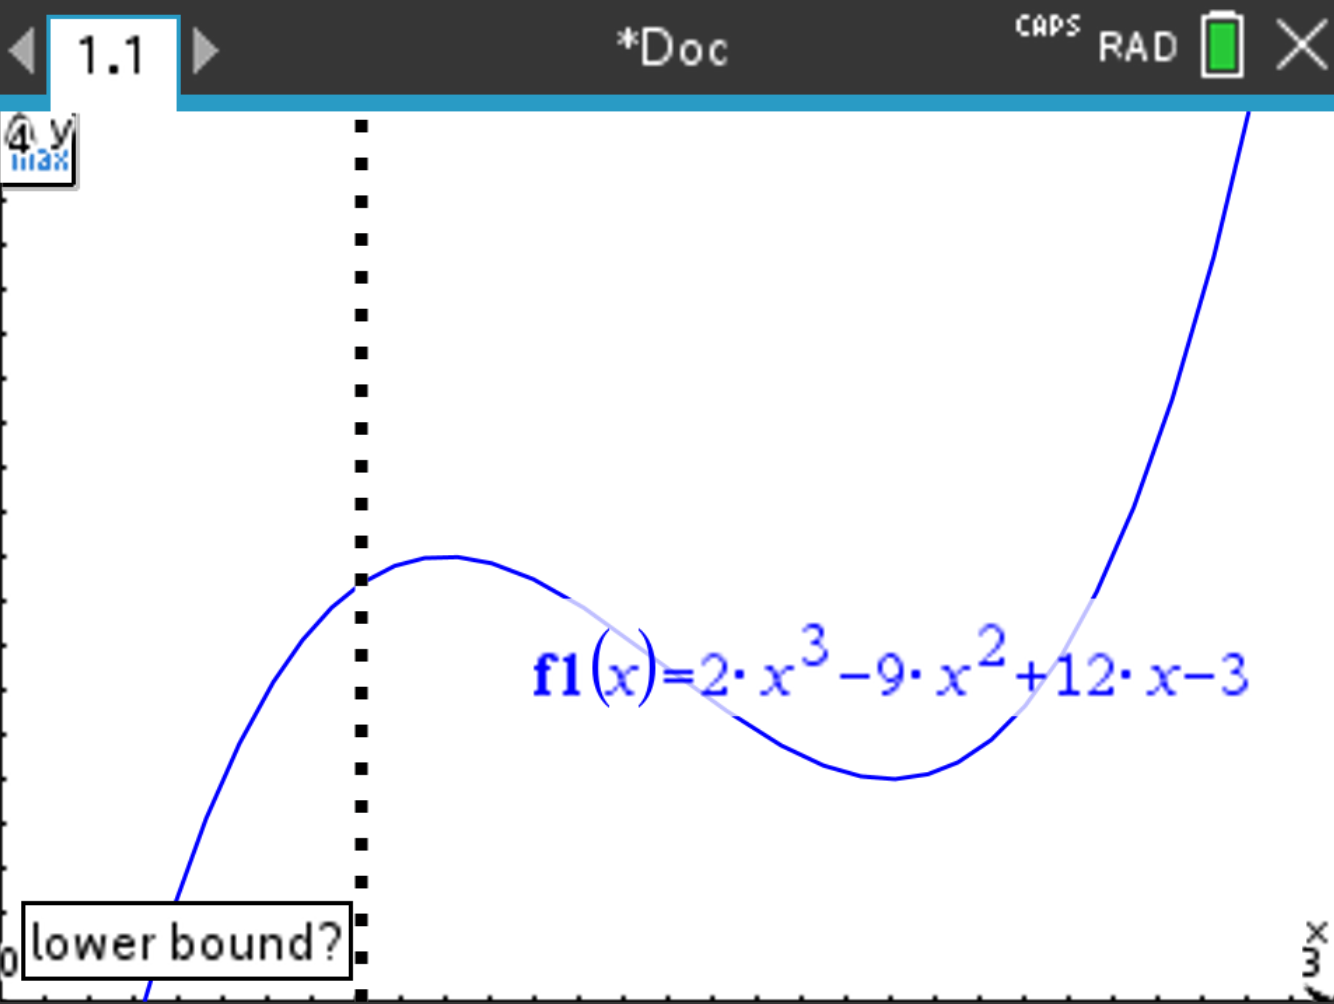
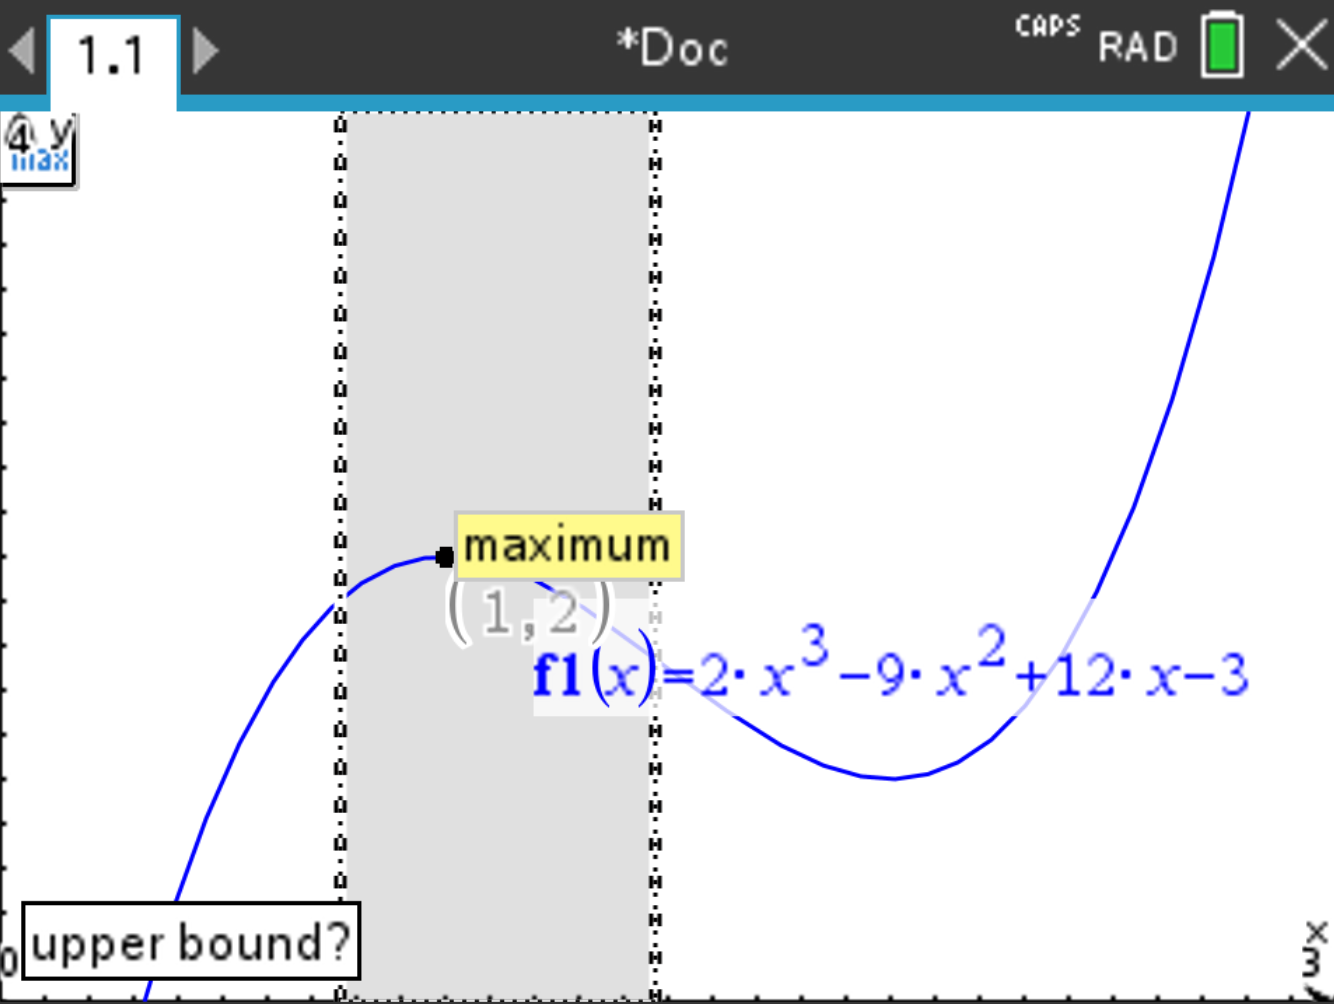
 and select Analyze Graph > Maximum.
and select Analyze Graph > Maximum.
and select Analyze Graph > Maximum.

.
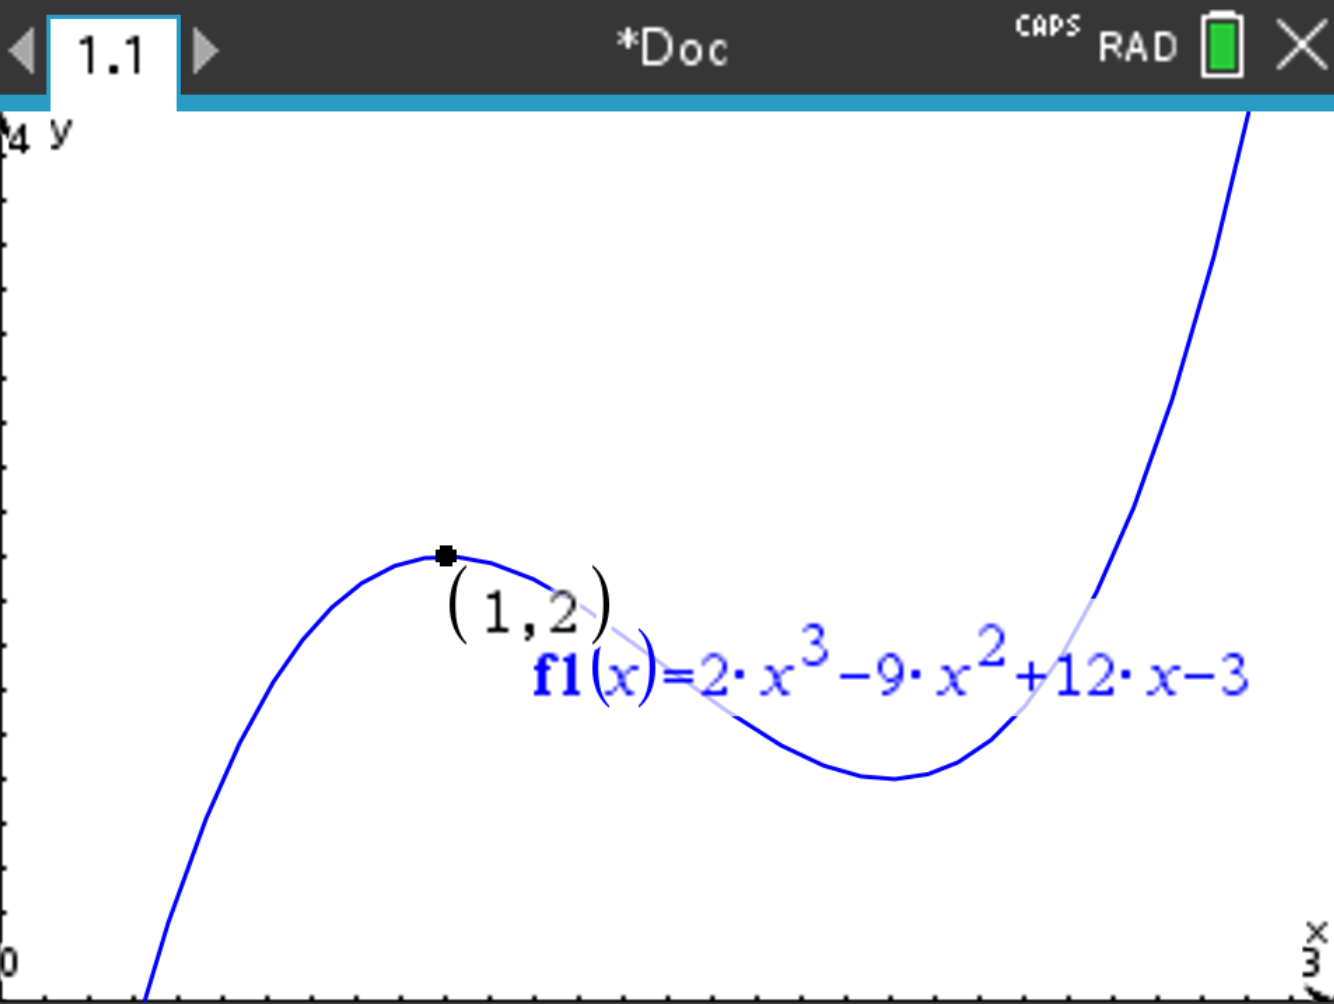
The result should be x = 1 and y = 2 (it is displayed next to the point). You can apply the same procedure to find a local minimum by pressing select Analyze Graph > Minimum instead of select Analyze Graph > Maximum.

This strategy is useful when one one only wants the y values of the global maximum or minimum. If you have to know the x values too, see above.
Suppose you want to find the maximum and minimum of the following function:
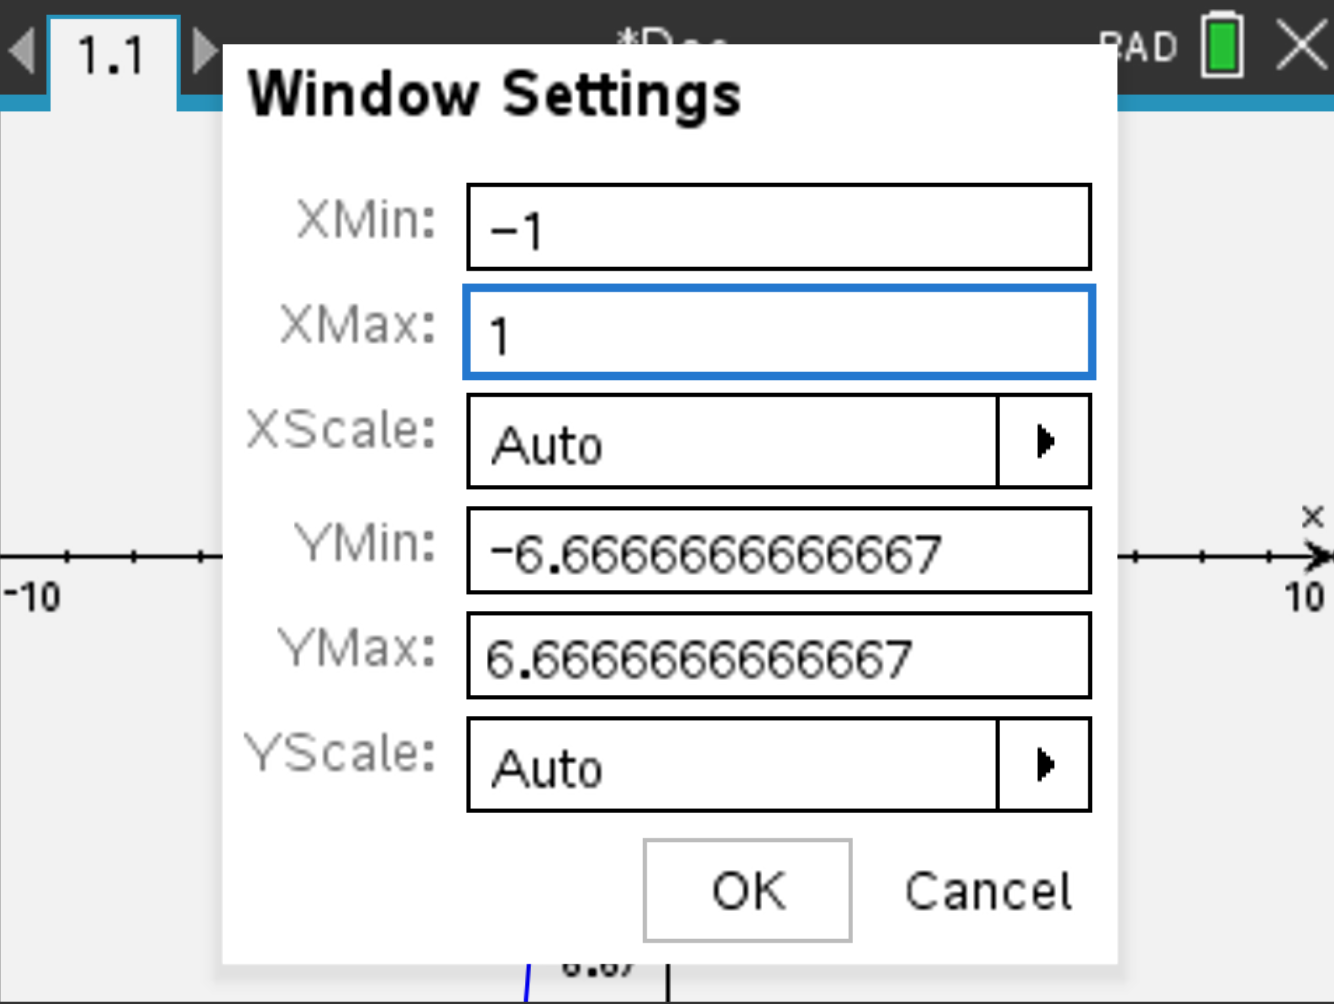
\[ f(x) = x^3 - x + 1, \quad -1 \leq x \leq 1. \]
and select Window / Zoom > Window Settings and fill Xmin and Xmax accordingly to the domain of the function:
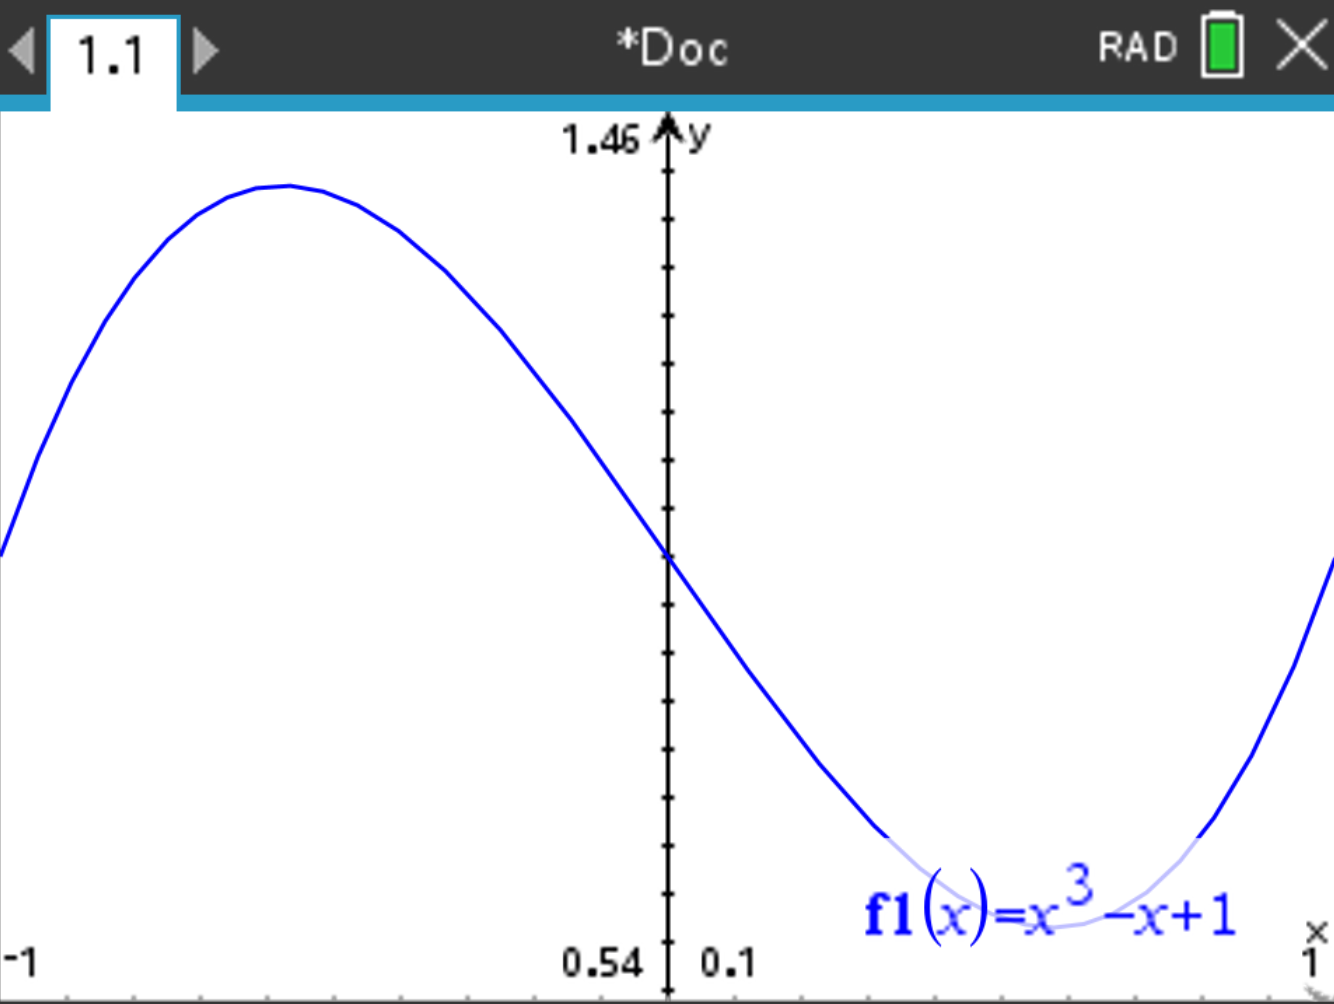
and select Window / Zoom > Zoom - Fit, and wait. The following should display:
and select Window / Zoom > Window Settings again, and read the values of Ymin and Ymax:
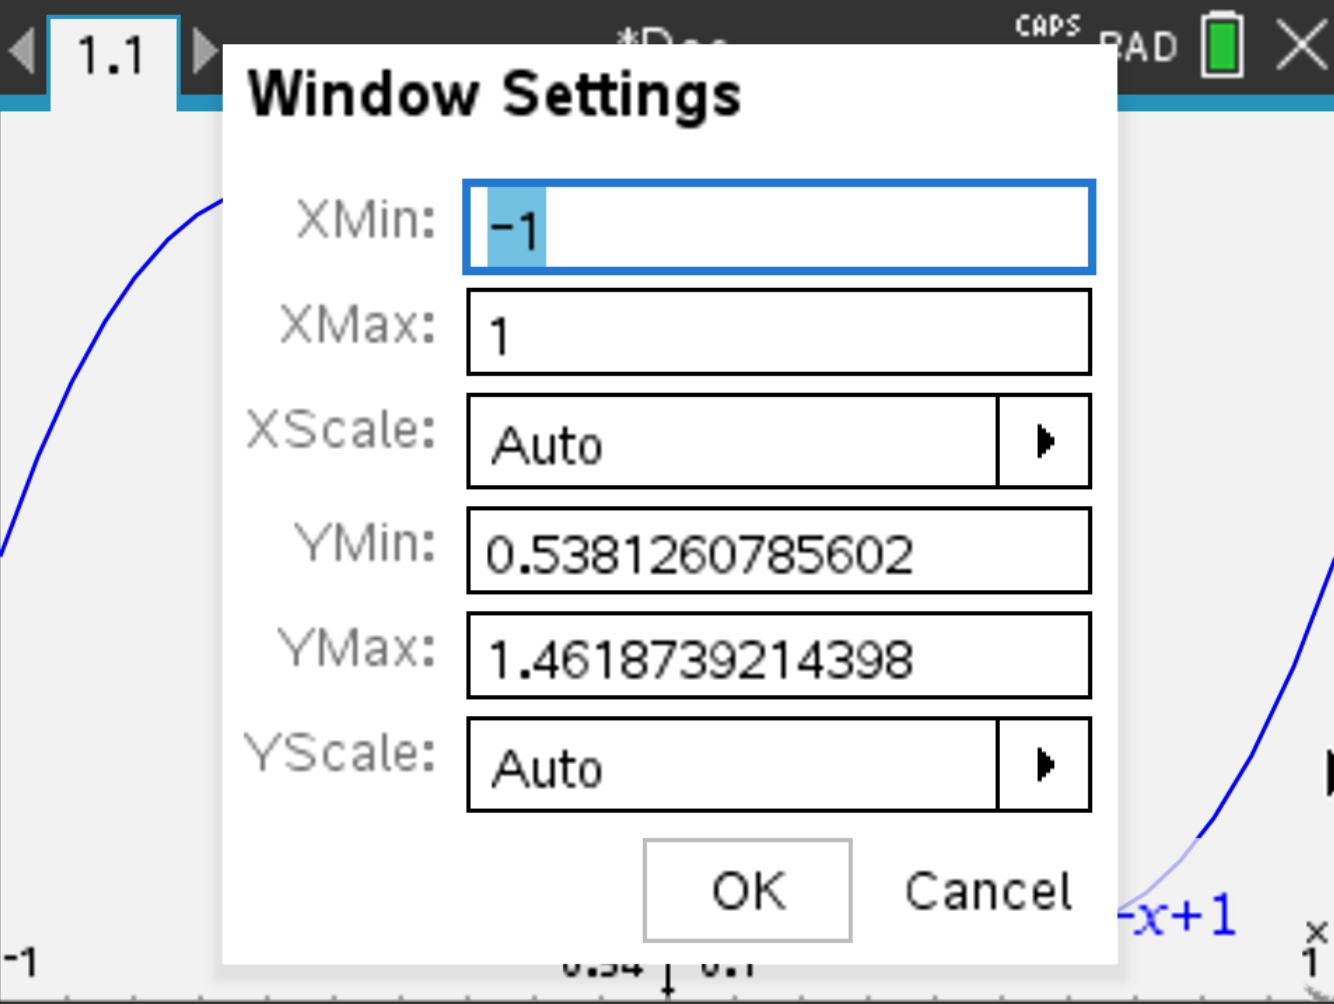
Thus, the minimum of f is 0.538, and the maximum is 1.462. Thus, the range of f is
\[ 0.538 \leq y \leq 1.462. \]
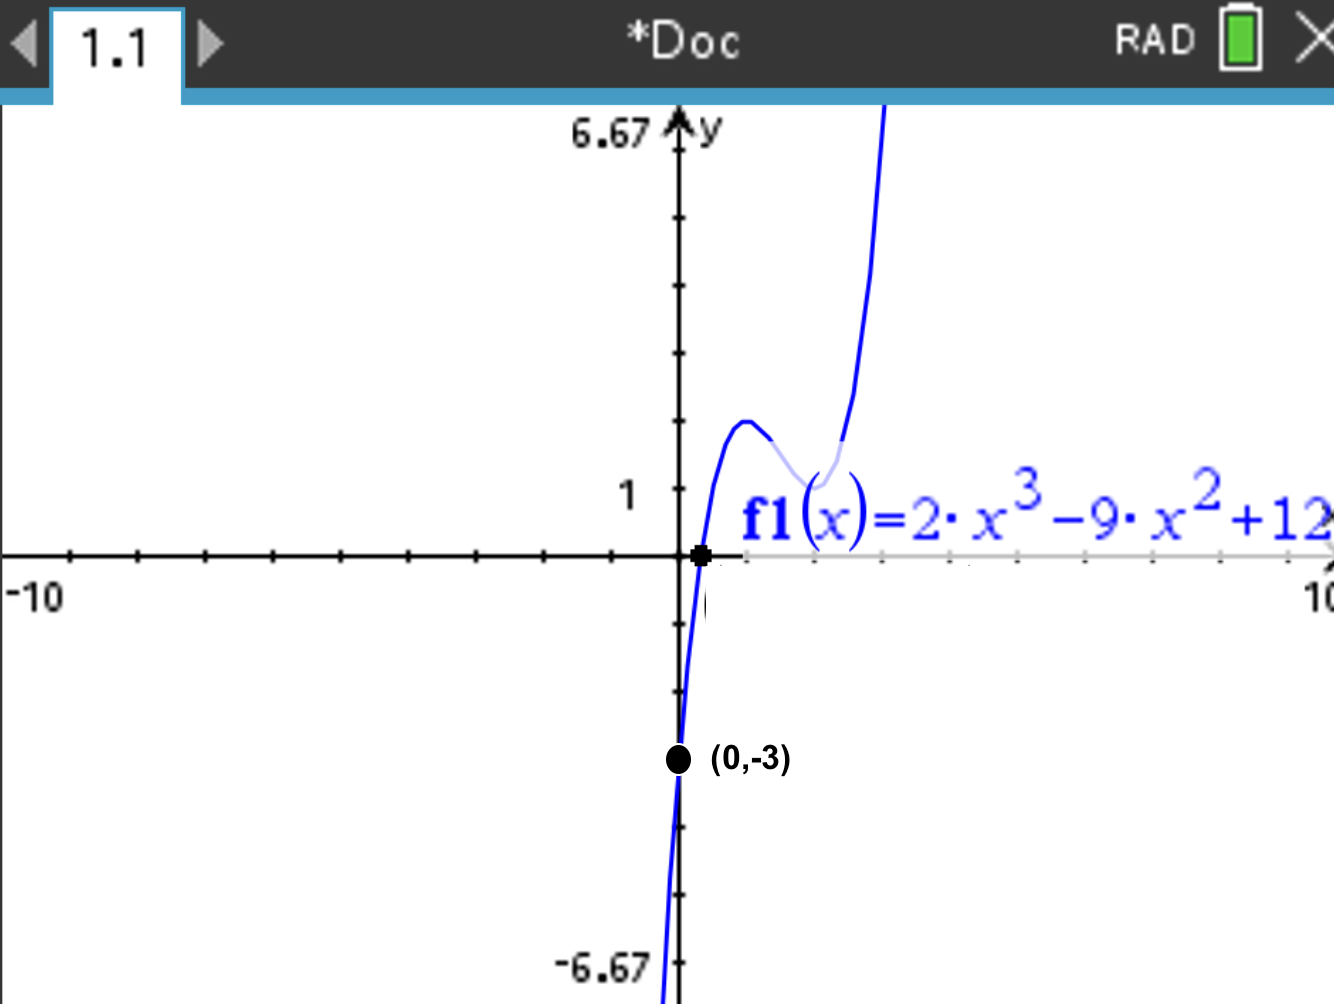
Suppose you want to know the local maximums and minimums of the following function:
\[ f(x) = 2x^3 - 9x^2 + 12x - 3 \]
Recall that we want to compute f (0).
and select Trace > Graph Trace. Press and it automatically shows the y−intercept.
The result Y=-3 should be displayed within the coordinate of the point (at the bottom right of the screen).
Suppose you want to know the local maximums and minimums of the following function:
\[ f(x) = 2x^3 - 9x^2 + 12x - 3 \]
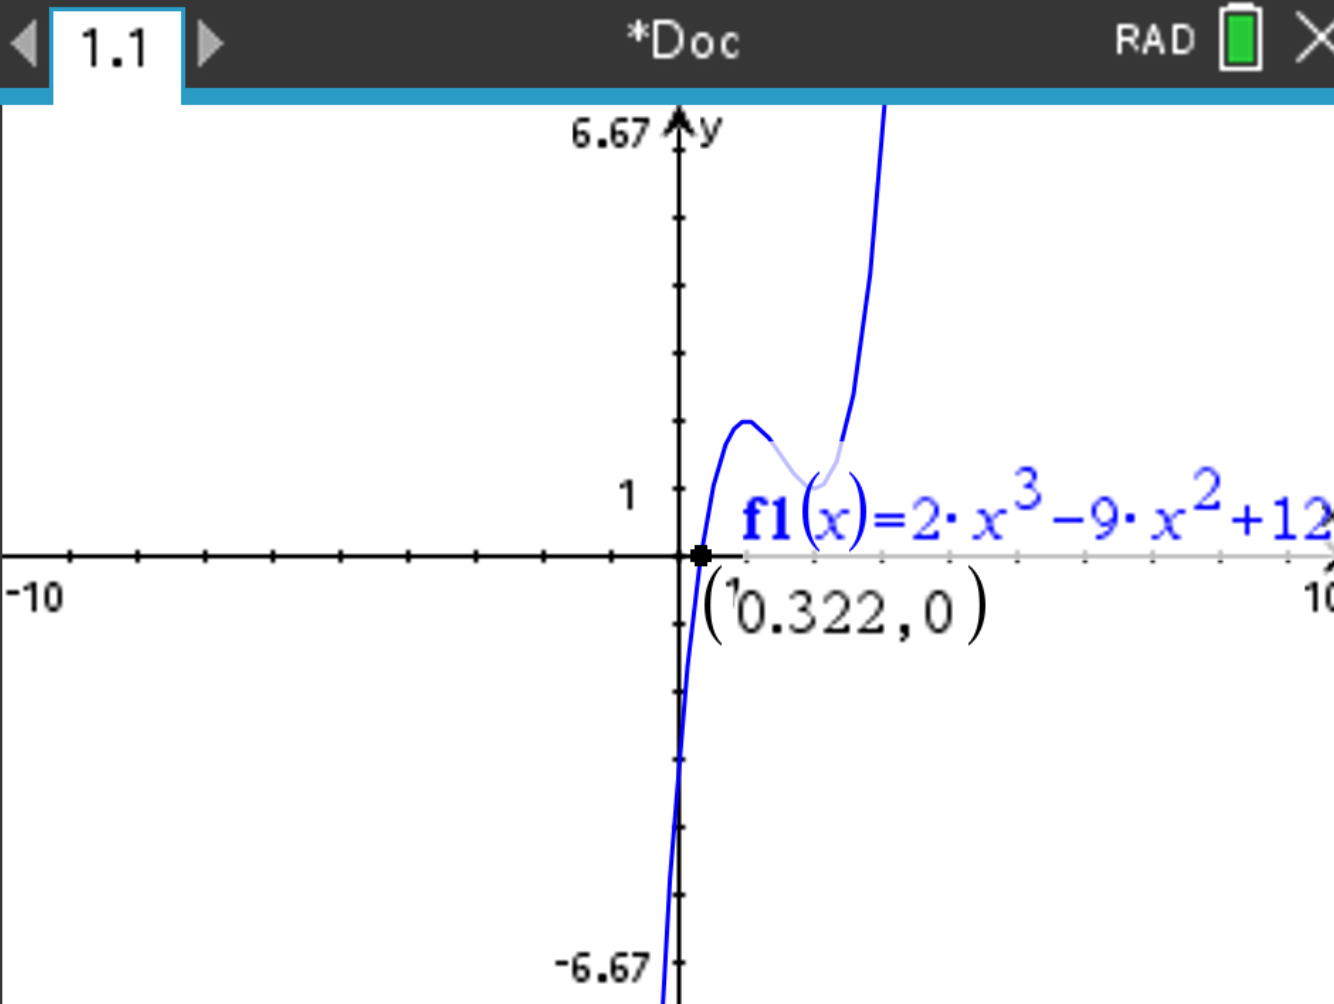
Recall that we want to compute the value of x when f(x)=0
aand select Analyze Graph > Zero. Select lower and upper bounds the widest possible. Press
The result X=0.322 should be displayed within the coordinate of the point.
\[ \frac{2x^3 - 4x + 2}{5x^3 - x^2 + 2} \]
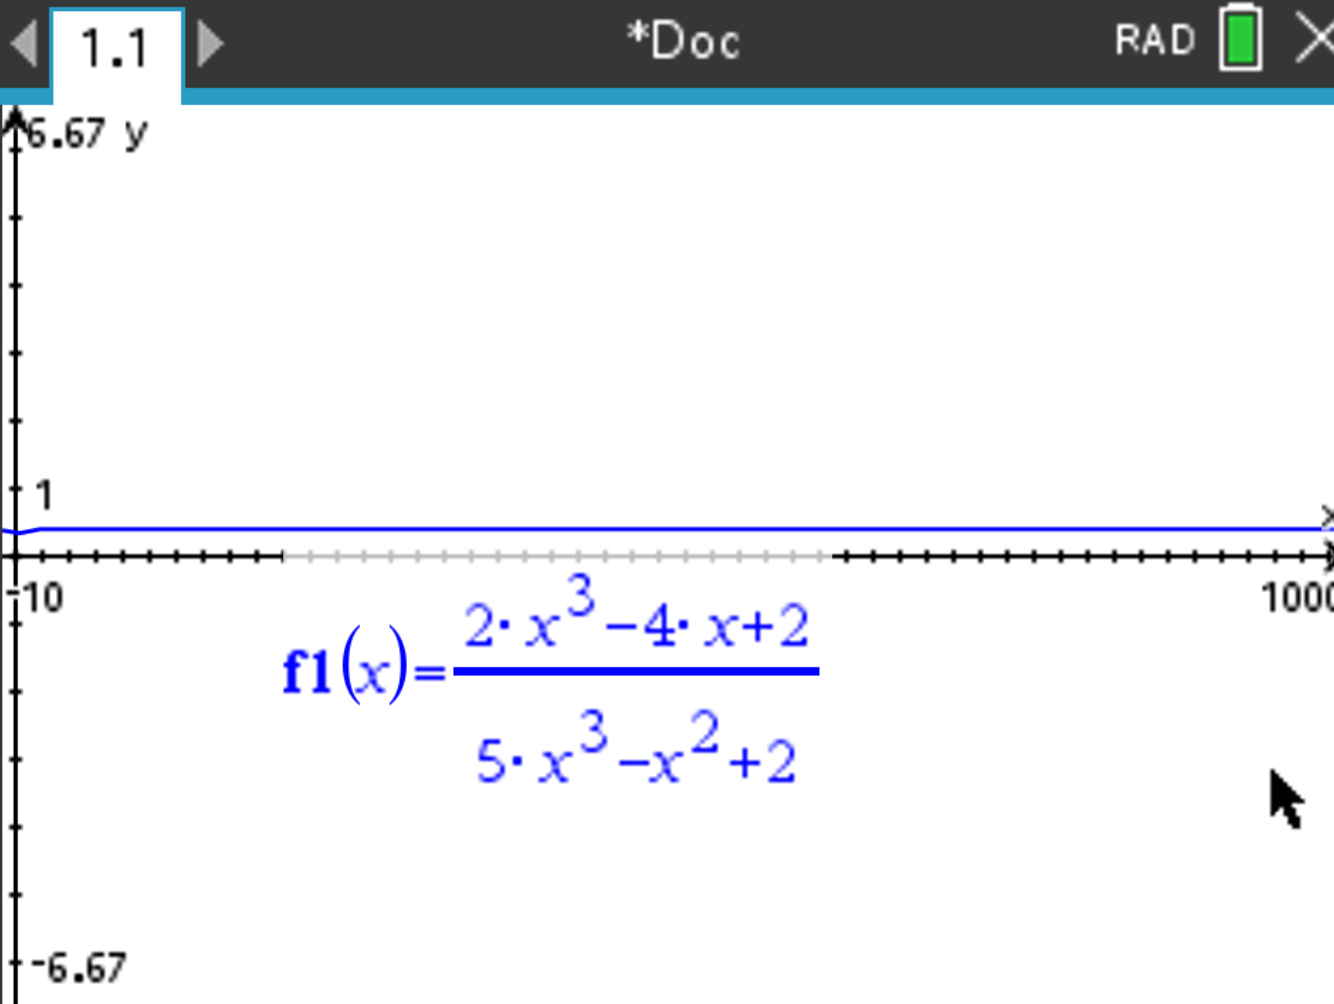
, select Analyze Graph > Maximum and take the y value of the maximum as the
value of the horitzontal asymptote:
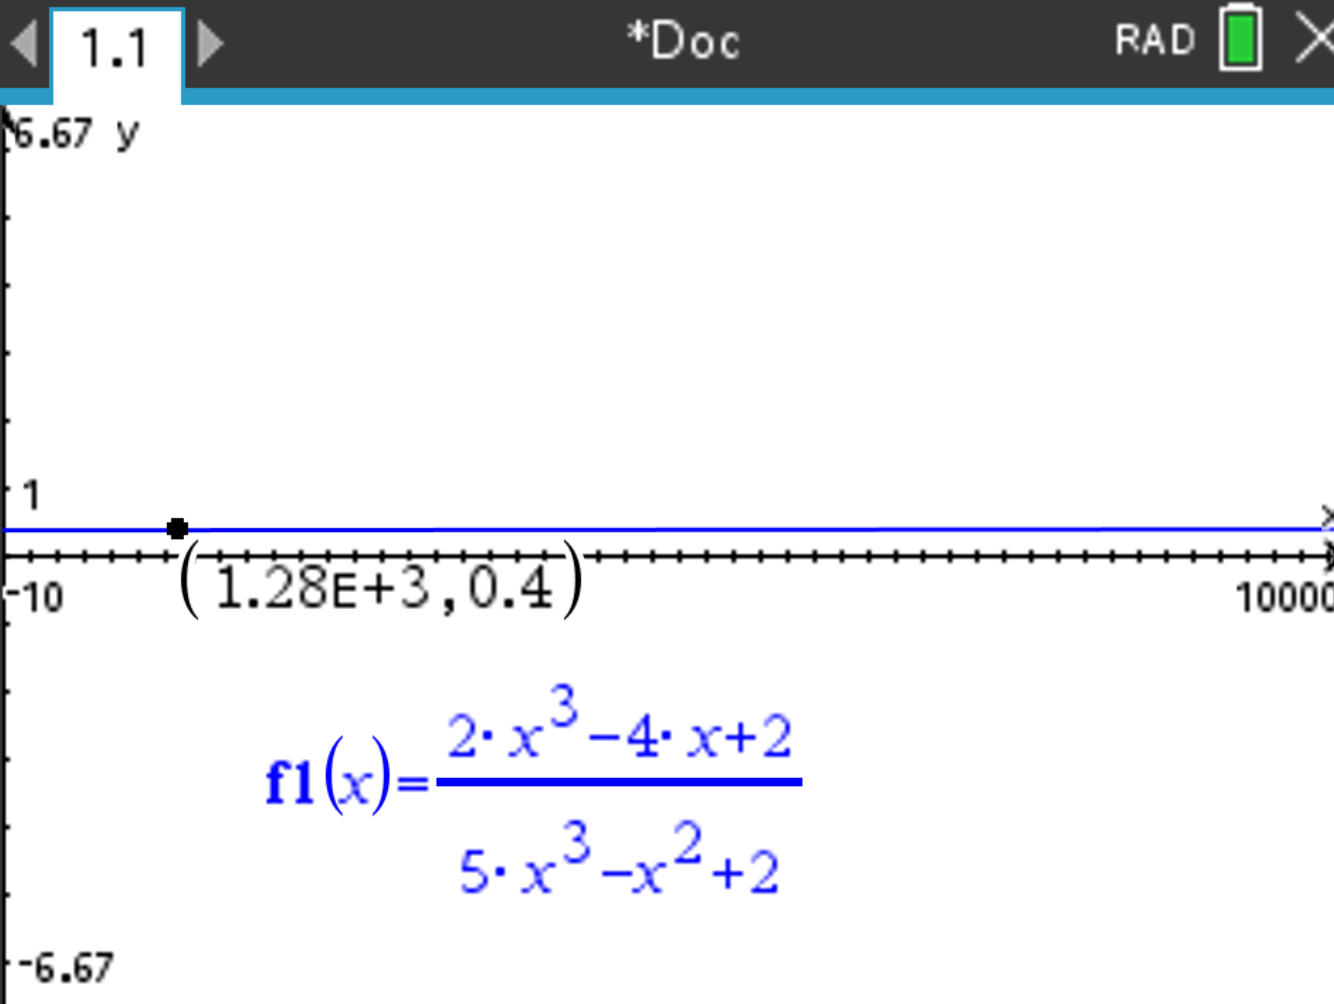
The result should be Y=0.4 (rounded).
\[ \frac{2x^3 - 4x + 2}{5x^3 - x^2 + 2} \]
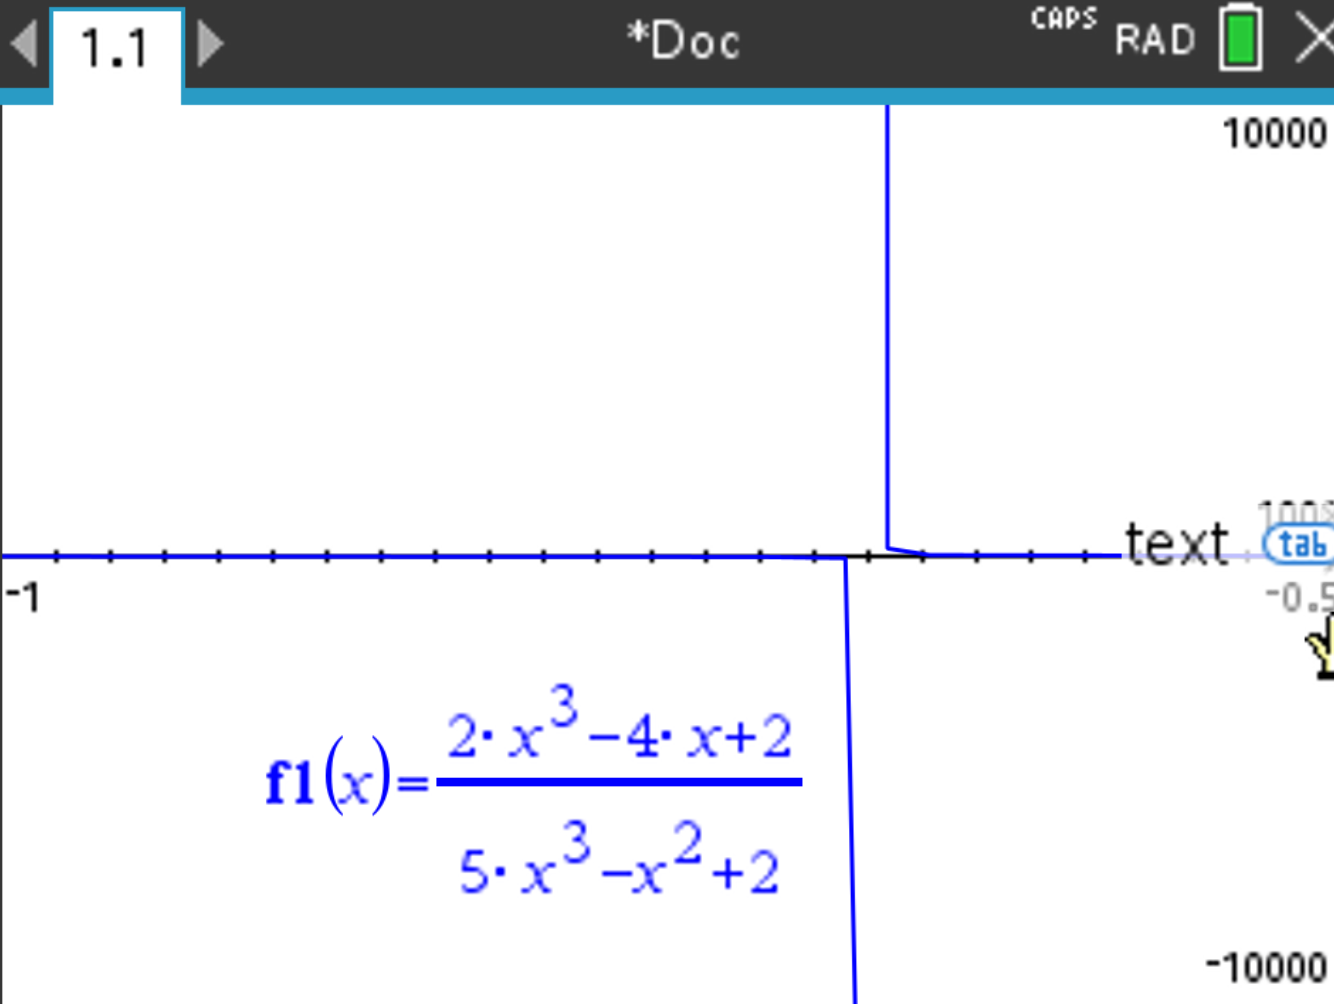
The result should be x = 0.676 (rounded).
Depending on how precise you want the result to be, you will have to zoom in more, and move again the cursor
\[ f(x) = x^2 - 2x + 2, \quad g(x) = \frac{x + 10}{4}. \]
and select Analyze Graph > Intersection.
. The intersection point coordinates are displayed:
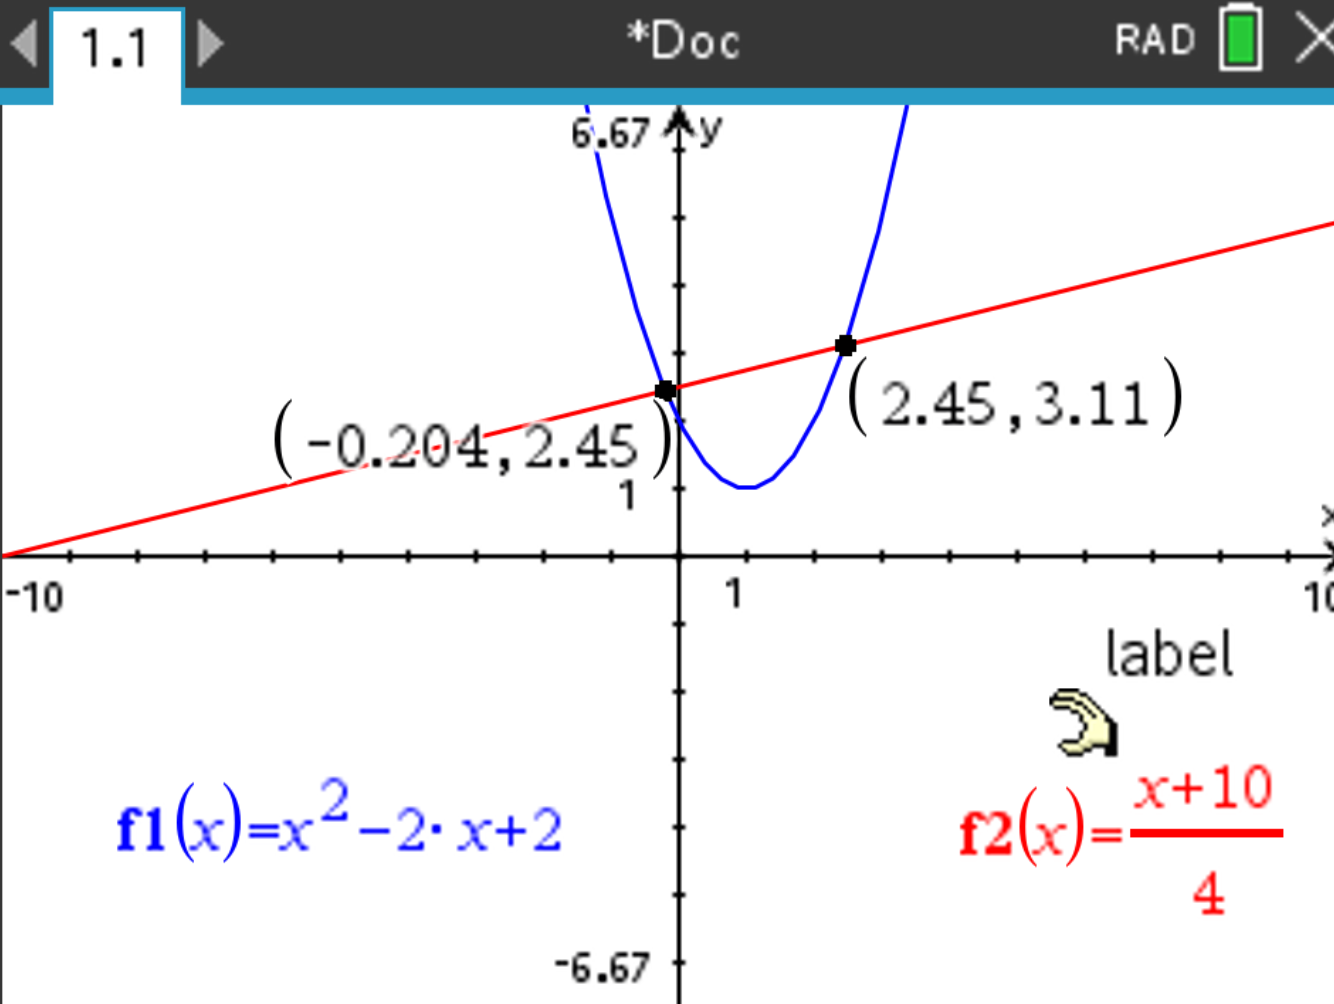
Press . The intersection points should be (-0.204,2.45) (left intersection point) and (2.45,3.11) (right intersection point) (rounded).