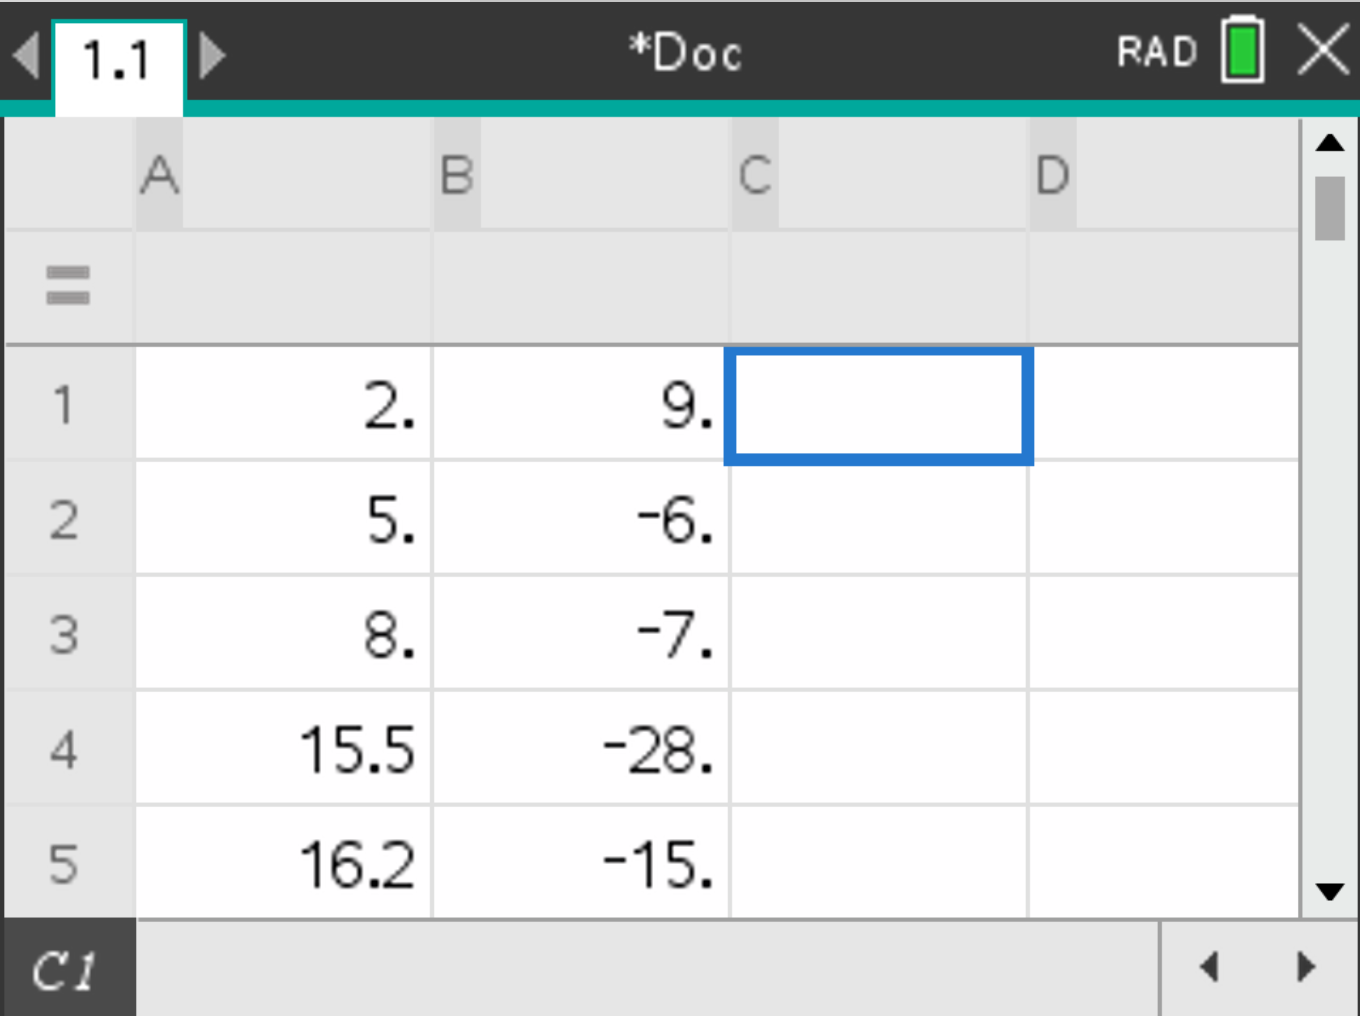
Consider the following set of data:
| x | y |
|---|---|
| 2 | 9 |
| 5 | -6 |
| 8 | -7 |
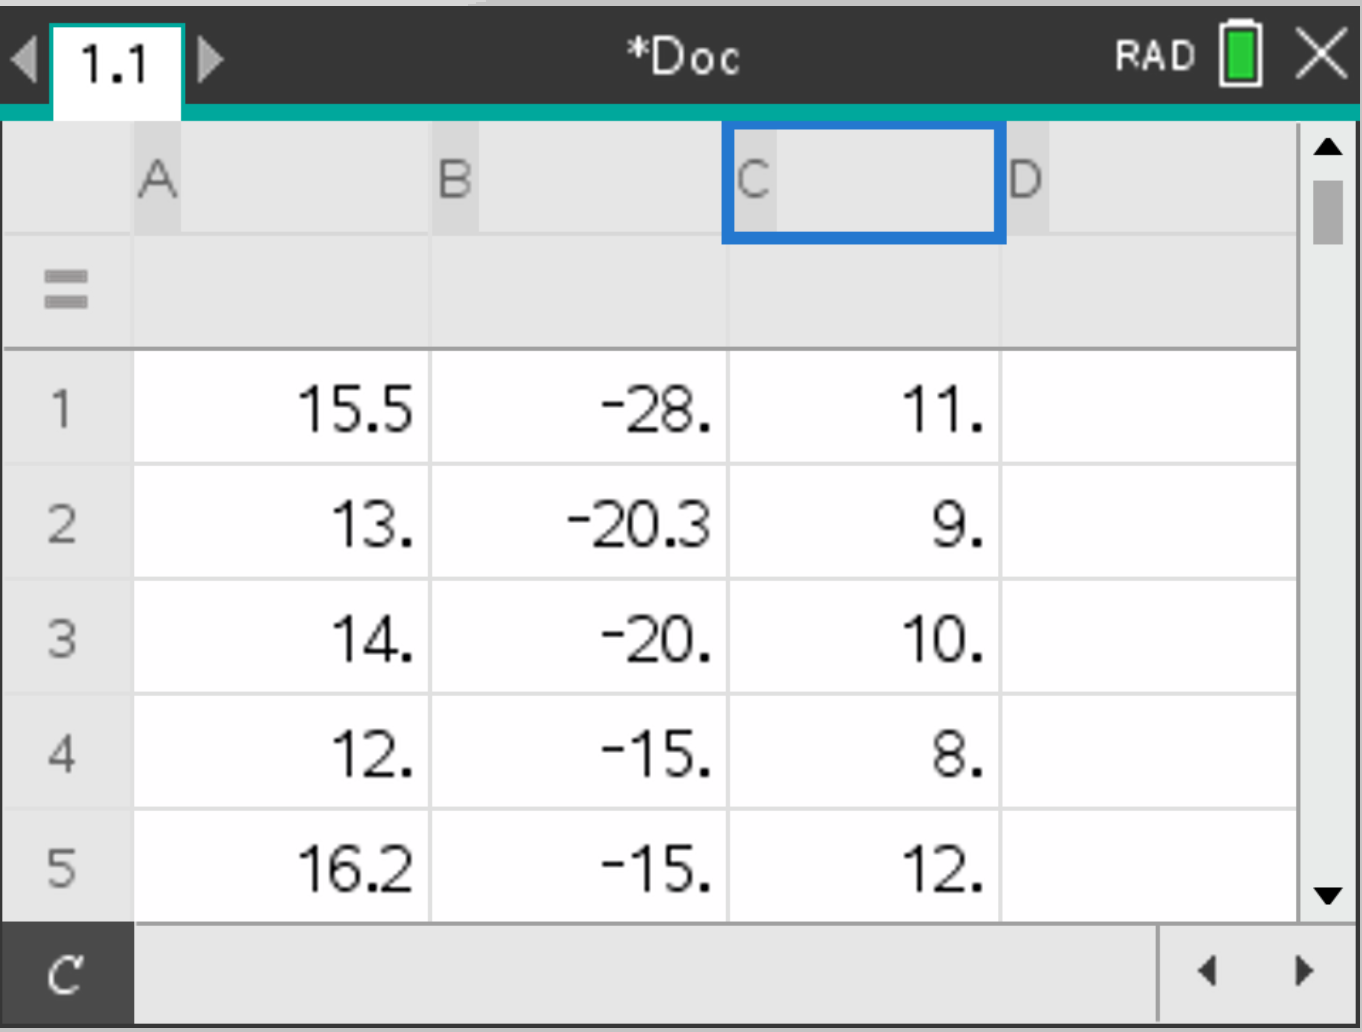
| 15.5 | -28 |
| 16.2 | -15 |
| 14 | -20 |
| 12 | -15 |
| 13 | -20.3 |
| 2.5 | 9 |
| 1 | 4.1 |
| 0.5 | 6 |
| -3 | 12.1 |
Let’s see how to rank these values with the TI-Nspire.
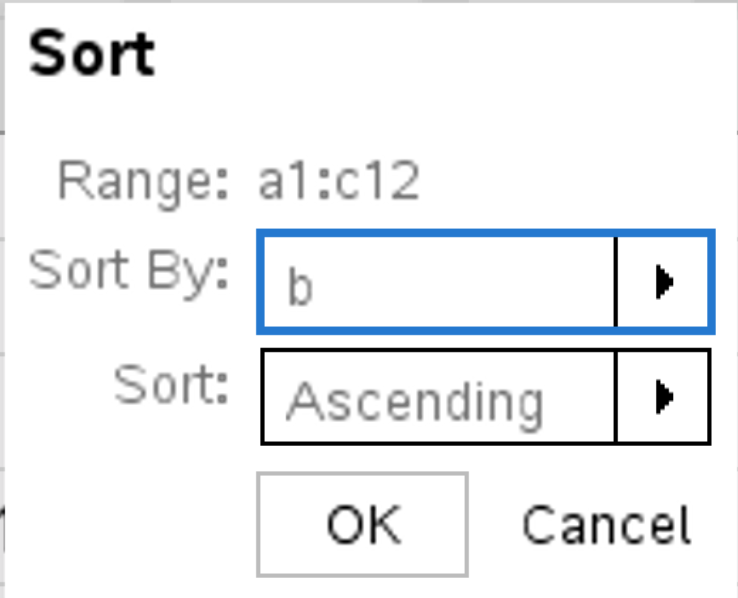
 and select Actions > Sort. Fill the parameters as follows and press
  .
.
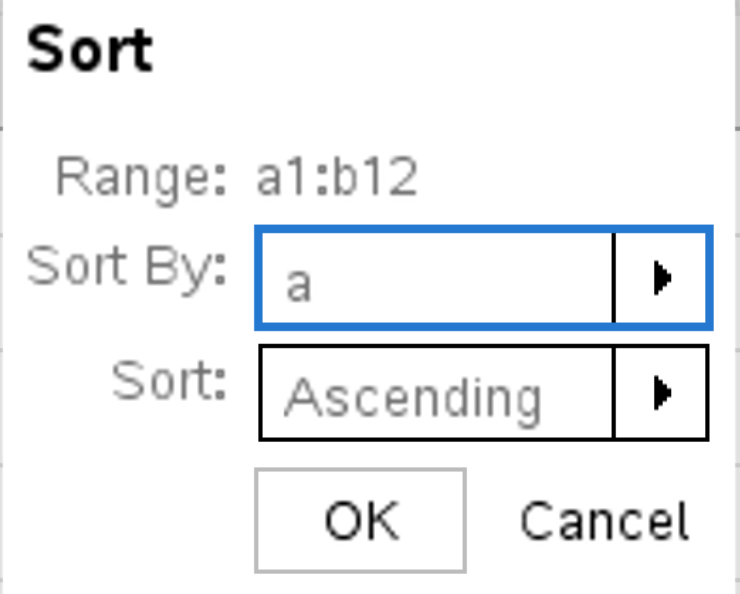
and select Actions > Sort. Fill the parameters as follows:
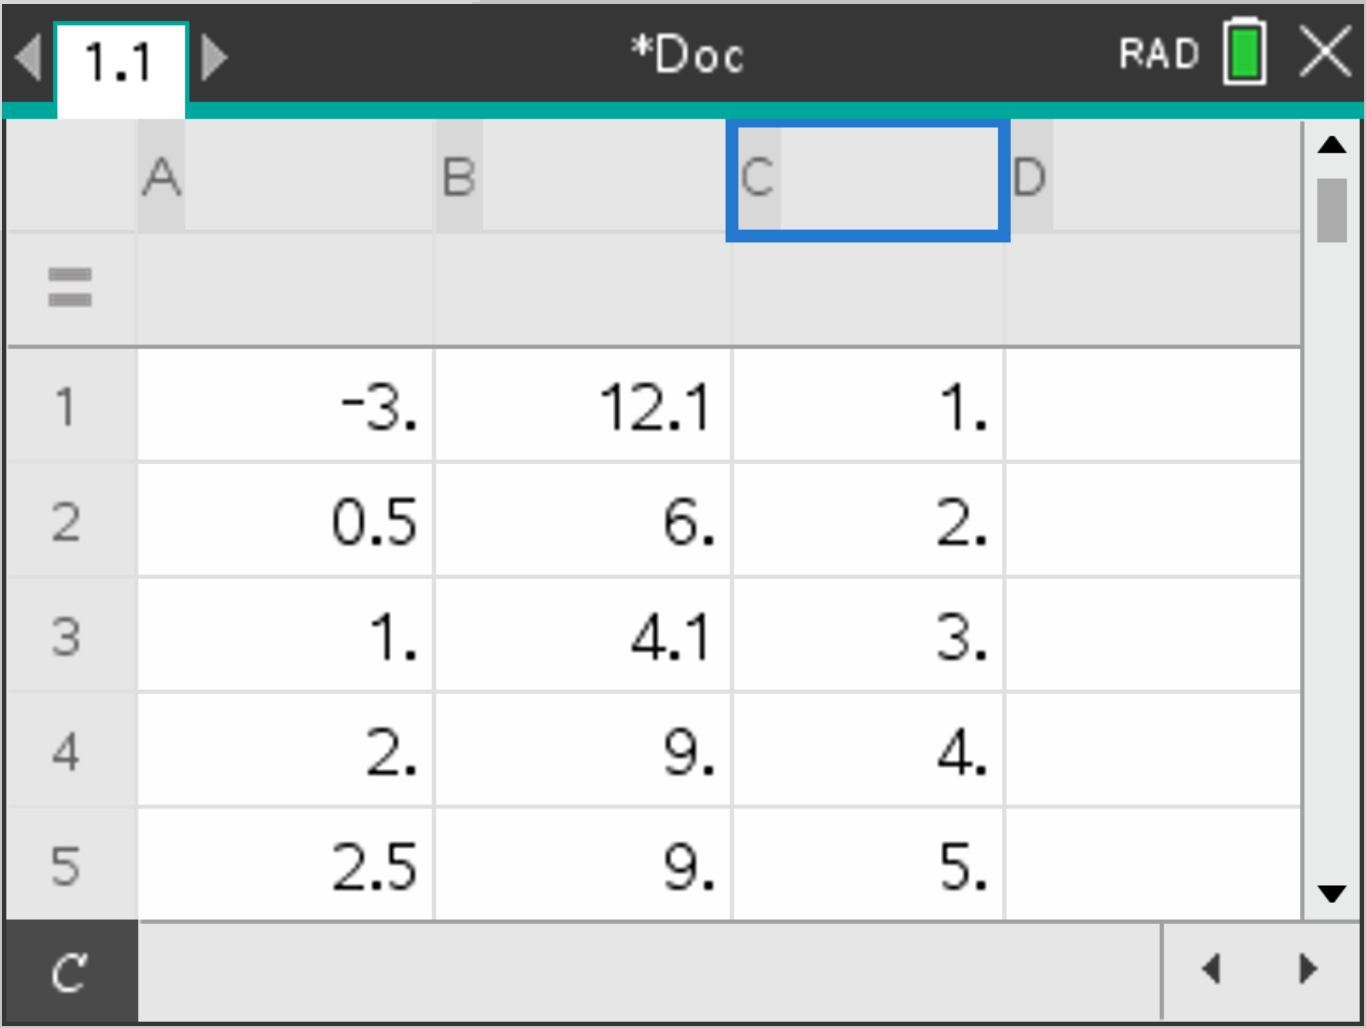
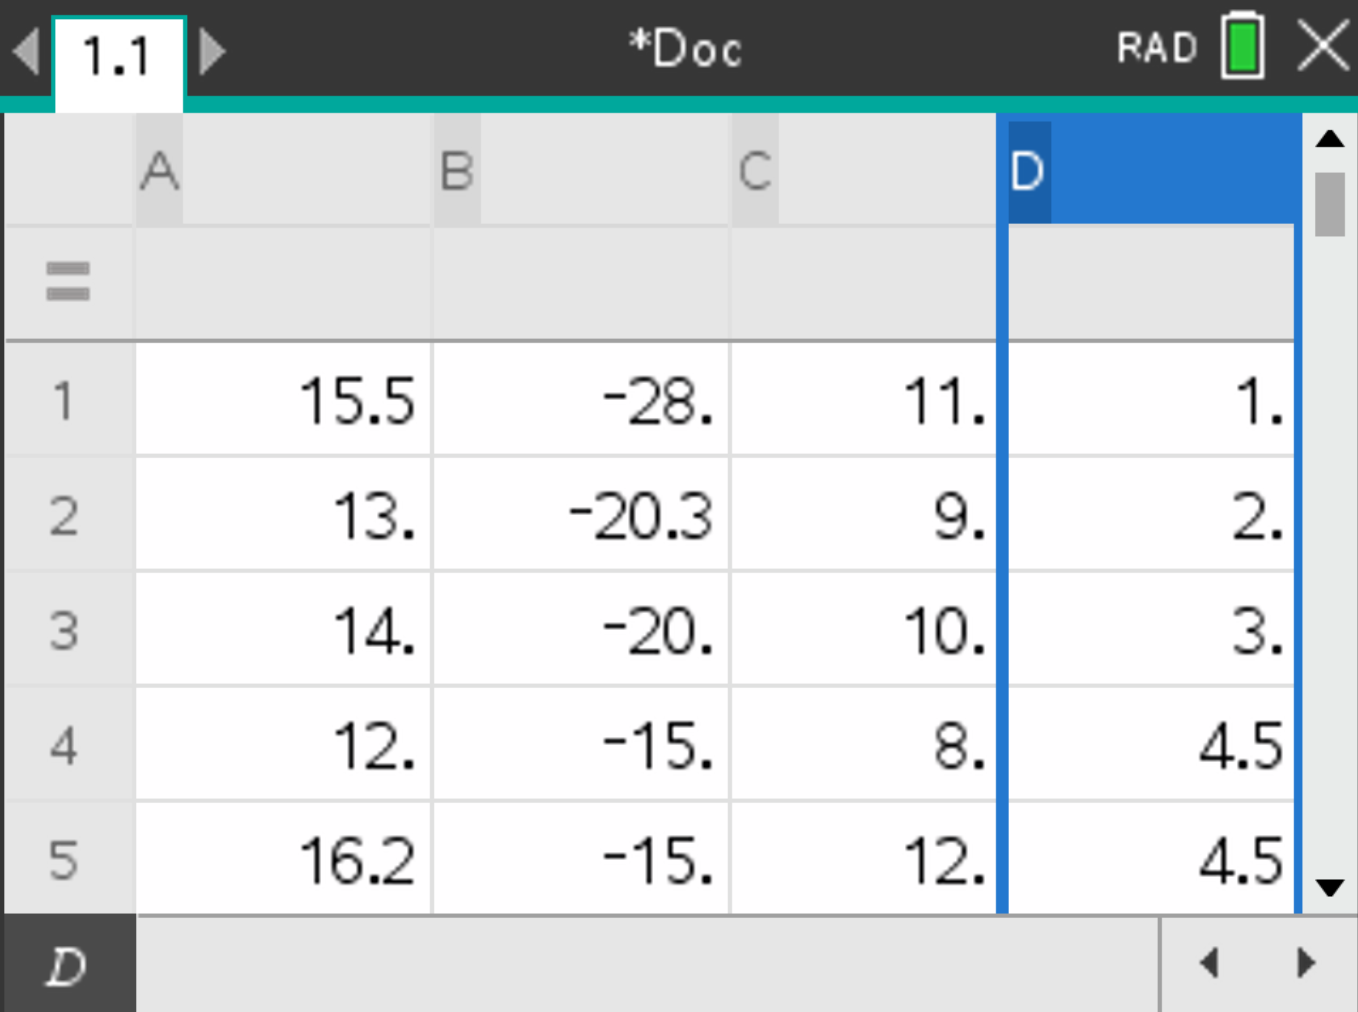
Press . This table should be displayed:
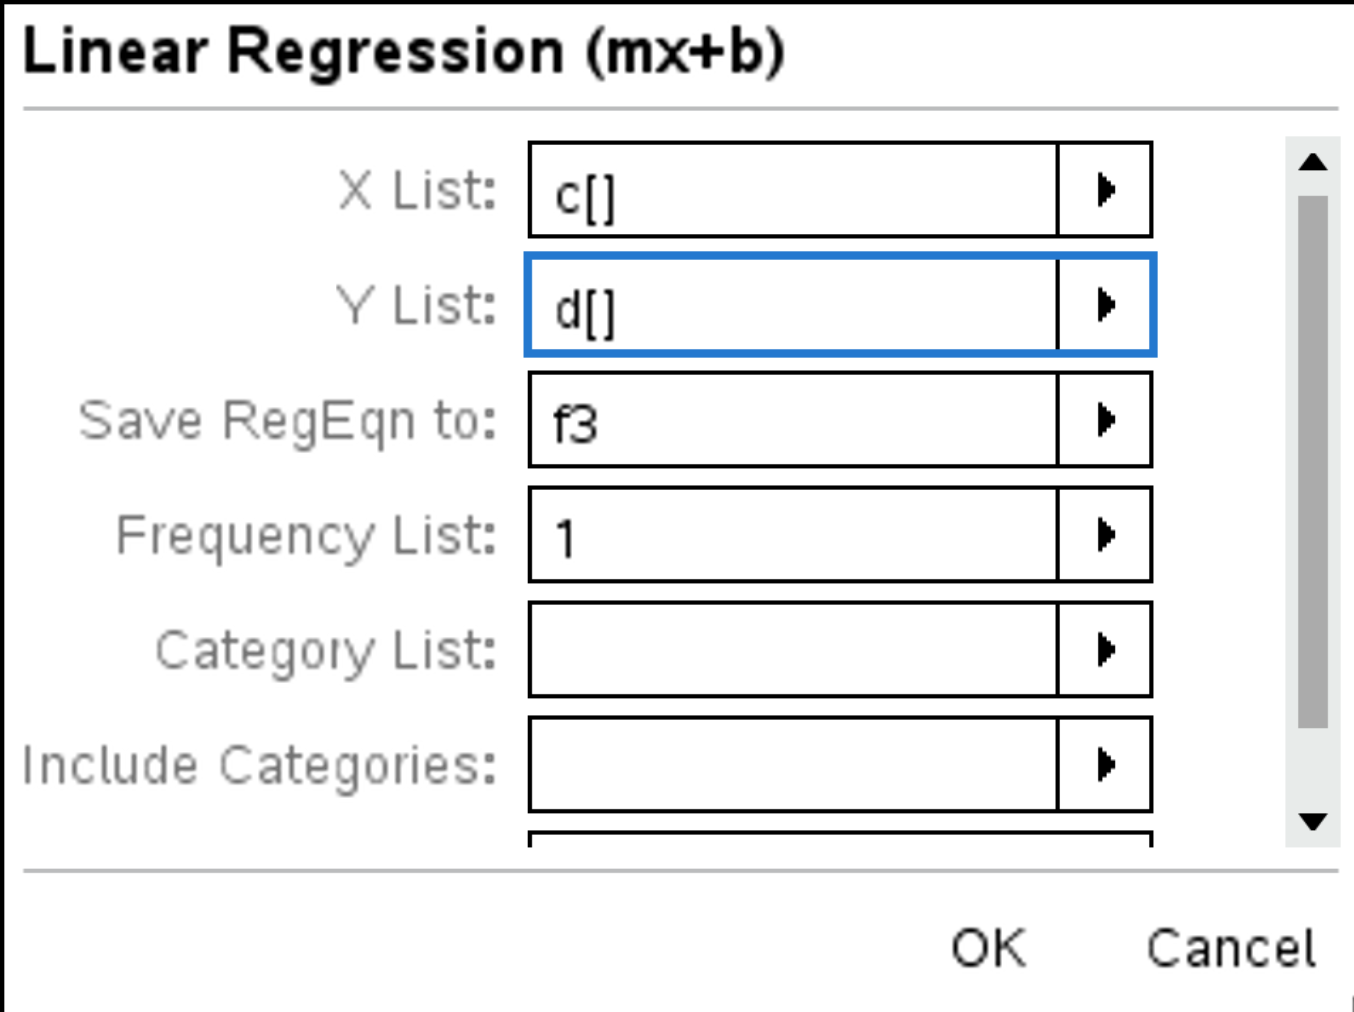
and select Statistics > Stat Calculations > Linear Regression (\(mx+b\)). Fill the parameters as follows:
The results should appear as follows:
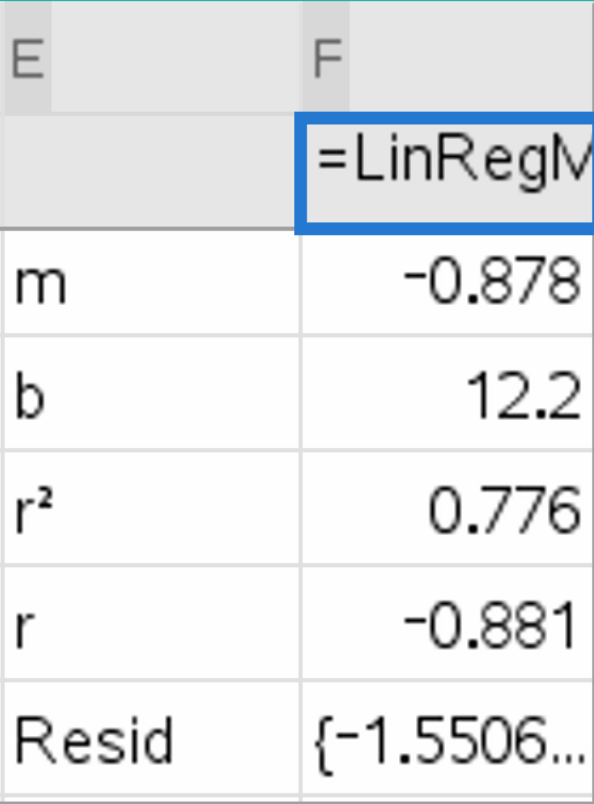
The \(r\)-value displayed is the ranked Spearman correlation coefficient.