Suppose you want to find graphically all the turning points of the following function:
\[ f(x) = x^3 - 6x^2 + 11x - 6 \]
f1(x).
f2(x) = \frac{df1(x)}{dx} by pressing  and
and  to graph the derivative of the function. Select only
 f2(x) to show only the derivative.
 and select
 Analyze Graph > Zero. . Repeat this process for the second zero.
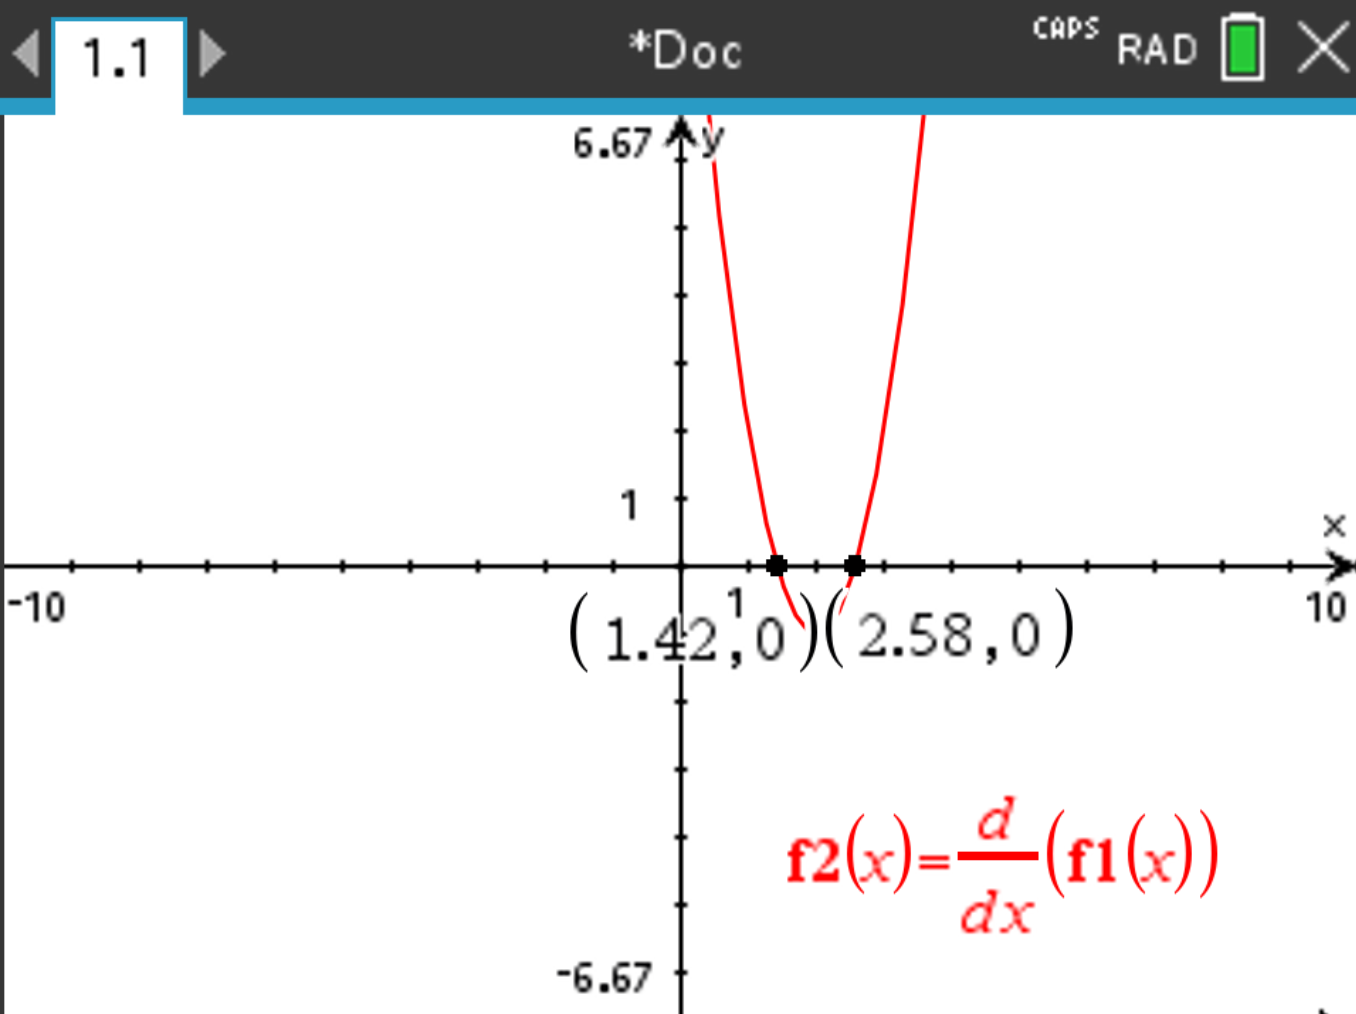
The results should be \( x = 1.42 \) and \( x = 2.58 \) (rounded).