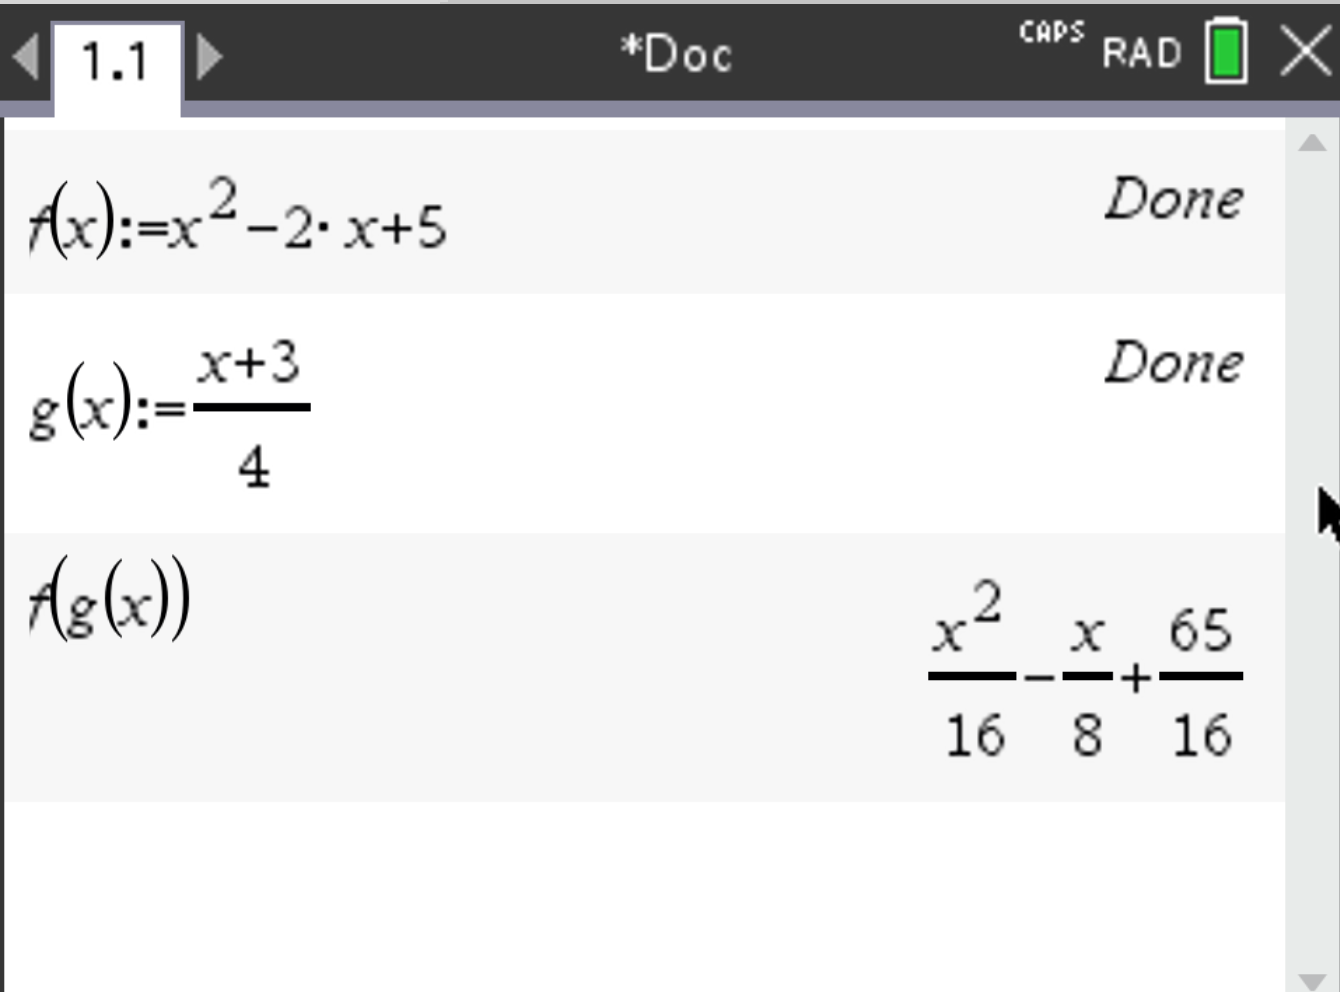
Suppose you want to graph \( (f \circ g)(x) \) for the following functions:
\[ f(x) = x^2 - 2x + 5, \quad g(x) = \frac{x + 3}{4} \]
 , and select Add Calculator.
f(x) and press 
 .
.f(g(x)) in a third line and press  . The result is displayed.
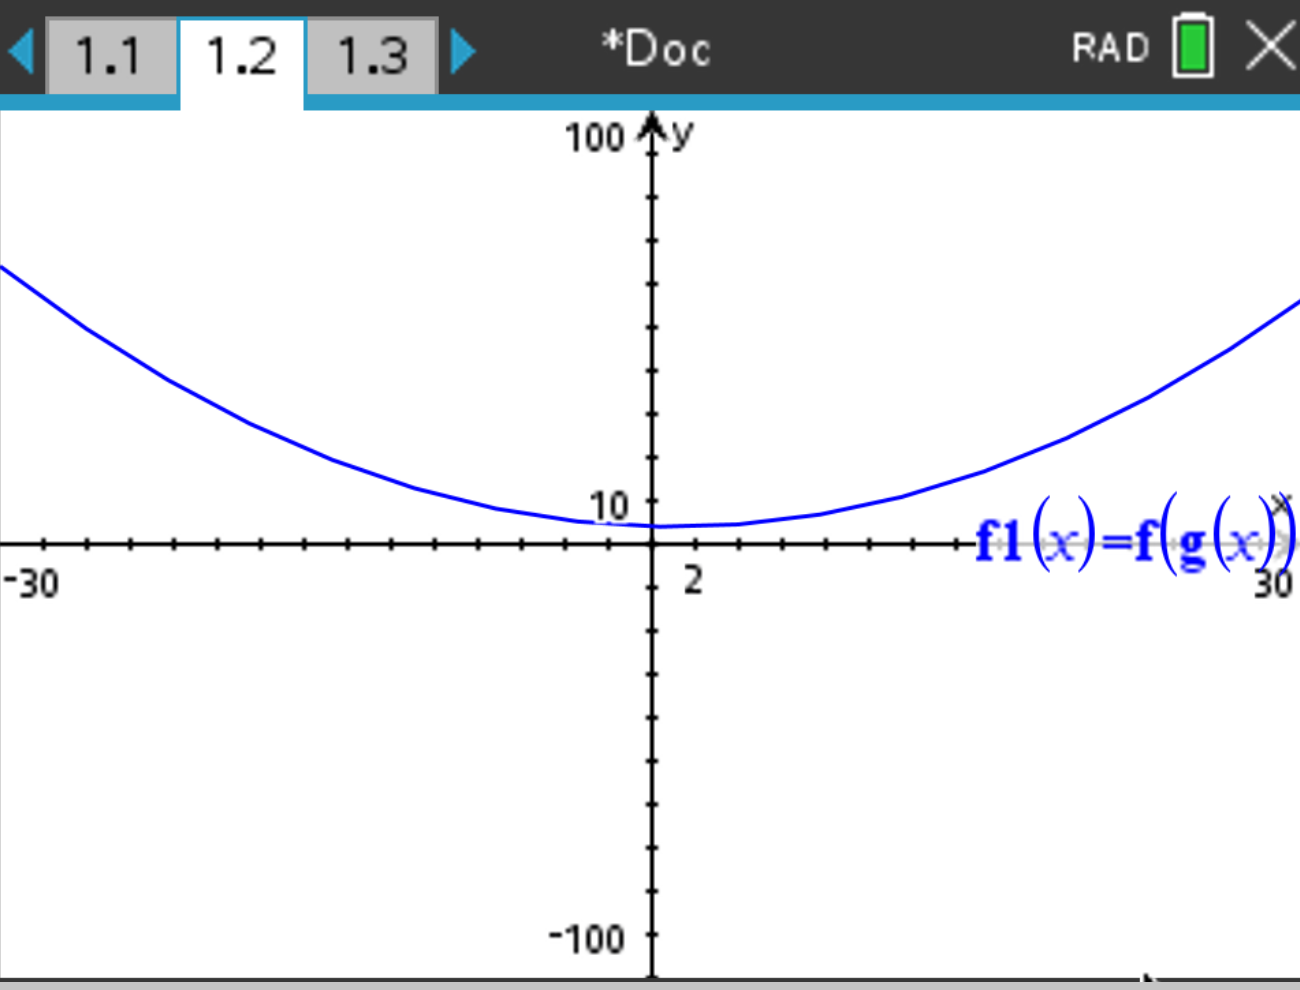
and . Select Add Graphs.
f1(x) = f(g(x)) and press .
 and select Window/Zoom > Window Settings. Enter the appropriate values:
\[
X_{\text{min}} = -30, \quad X_{\text{max}} = 30, \quad Y_{\text{min}} = -100, \quad Y_{\text{max}} = 100
\]
and select Window/Zoom > Window Settings. Enter the appropriate values:
\[
X_{\text{min}} = -30, \quad X_{\text{max}} = 30, \quad Y_{\text{min}} = -100, \quad Y_{\text{max}} = 100
\]
Suppose you want to evaluate \( (f \circ g)(1) \) for the following functions:
\[ f(x) = x^2 - 2x + 5, \quad g(x) = \frac{x + 3}{4} \]
, and select Add Calculator.
f(x) and press and .f(g(1)) in a third line and press . The result is displayed.
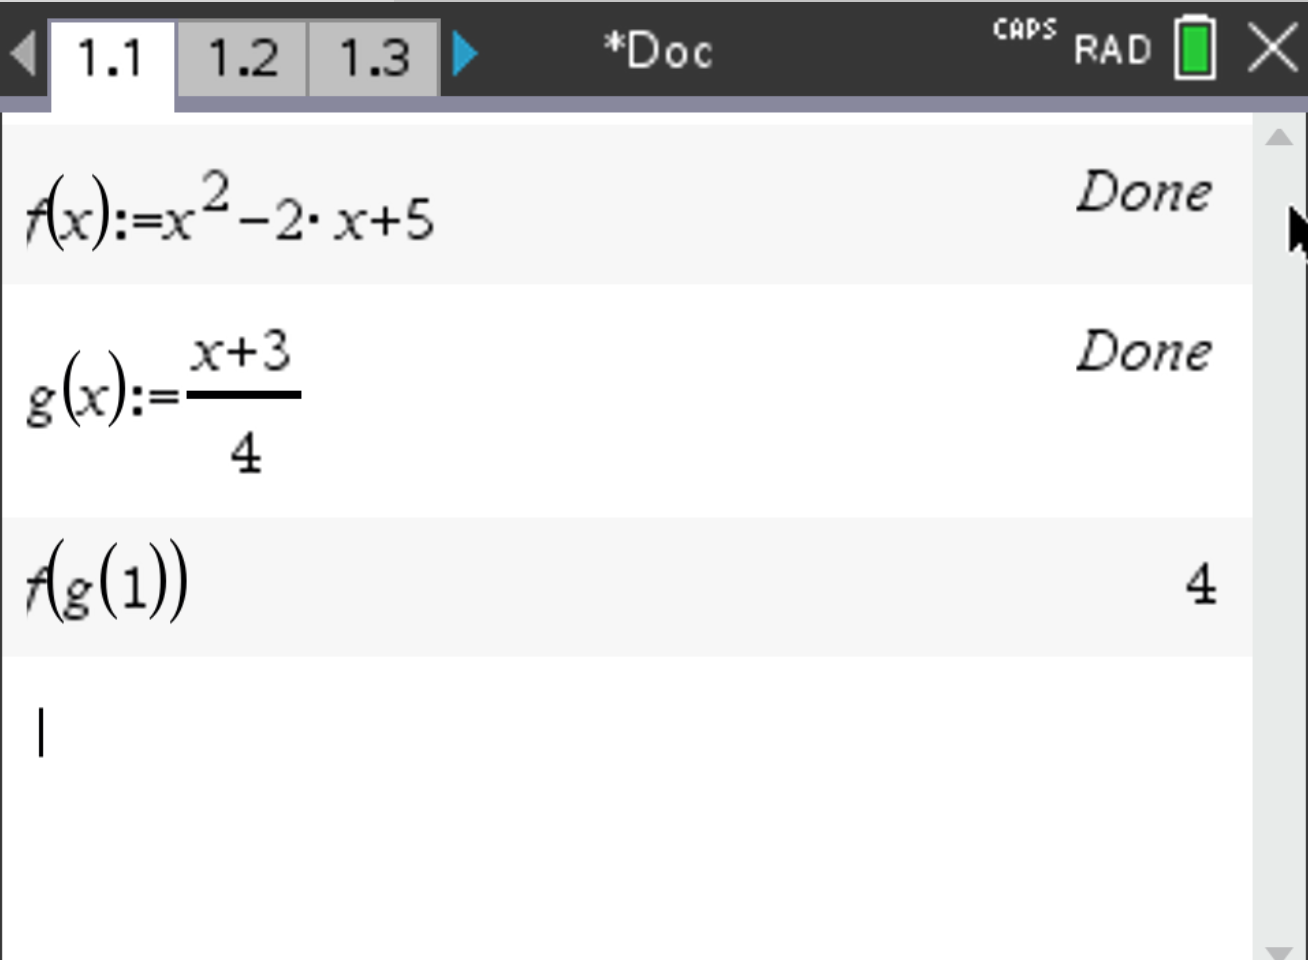
The result should be \( 4 \). Thus, \( (f \circ g)(1) = 4 \).